
Commodities Tracker: March 2026
Nuclear Energy and Uranium
Key Takeaway
The closure of the Strait of Hormuz exposed the fragility of global energy supply chains, highlighting energy security as a critical consideration for global policymakers. We see parallels between this environment and the oil crises of the 1970's, which helped spur nuclear power buildouts in the following decades.

Advanced nuclear energy startup, X-Energy filed for an IPO on March 20th under the ticker "XE."1 X-energy operates two core business lines: 1) It develops its Xe-100, an advanced small modular reactor (SMR) the Xe-100, a helium-cooled reactor that runs off TRISO-X fuel pellets, scalable at 4-12 units per site, and 2) It also fabricates TRISO-X fuel, which is a HALEU fuel intended to be complimentary to X-energy reactors and that can also be used in other reactor designs.2
South Korea announced plans to speed up the restart of nuclear reactors currently undergoing maintenance in a bid to secure energy following the outbreak of the war in the Middle East. Two units are aiming for expedited restarts this month while another four are aiming to restart by mid-May. The announcement highlights the nation's efforts to head off potential supply disruptions from the conflict in the Middle East. South Korea imported over 40 million tons of LNG in 2025, nearly 14% of which was from Qatar.3
PRICE ACTION
Uranium spot prices fell to around $84/pound by March 20th, while term prices started the month at $90/lb.4,5 Spot market demand was generally subdued as investors continued to assess volatile energy markets. Utility contracting remains moderate, with multiple utilities seeking mid- and longer-term coverage in off-market discussions, which we believe continues to be reflected in tightening fundamentals and rising term prices.6
OUTLOOK
The disruption of shipments through the Strait of Hormuz has laid bare the fragility of global energy supply chains, which we believe strengthens the argument for alternative sources of power in the age of electrification. France illustrates an excellent example of a nation that took policy actions to address energy security concerns following the historic oil crises of the 1970sthe country moved to broaden its nuclear footprint through the Messmer plan, which spurred the construction of 56 new reactors between 1974 and 1989. This multi-decade policy shift substantially expanded global nuclear power generation capacity and elevated France to become a global leader in nuclear power.7 While we acknowledge the impact that elevated interest rate risks have on new nuclear projects, we think the corresponding energy supply shock may very well drive global policy-makers to re-evaluate their power grids amidst rising energy security concerns.
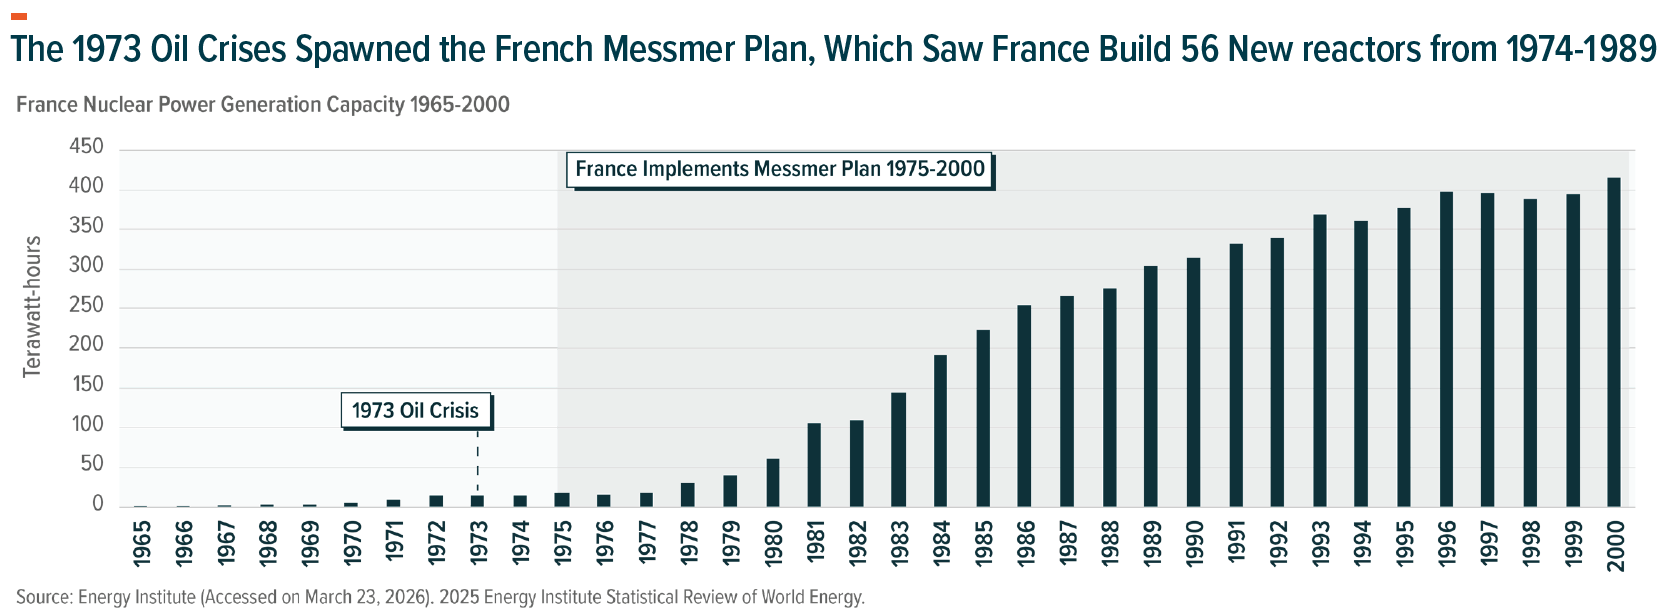
In 1974, France initiated the Messmer Plan which sought to achieve energy independence by targeting 80 new nuclear reactor starts by 1985 and 170 by 2000.8 Today, the French source nearly 70% of their electricity from nuclear energy.9
Copper
Key Takeaway
Copper saw healthy demand from Chinese industrials in March, as softening prices drove purchasing activity. Industrial metals remain under pressure amidst continued macroeconomic uncertainty but may be well-positioned if trade via the Strait of Hormuz normalizes in a timely manner.
In March, Chinese copper inventories saw their largest monthly drawdown so far in 2026, which sparked buying by Chinese industrials returning from the Chinese Lunar holiday. Refined copper inventories in China fell by 78,700 tons between March 16th and March 23rd, as fabricators drove a surge in new orders. Heightened Chinese demand coupled with falling copper prices amidst the War in Iran led some Chinese industrials to increase their daily purchases versus last year's averages.10
Copper largely gave up its gains year-to-date, as industrial metals slid on fears of macroeconomic weakness amidst the conflict in Iran. Escalating attacks across the Persian Gulf drove up energy prices to multi-year highs, threatening the industrial demand outlook for copper while volatility in interest rates pushed the dollar higher, weighing on non-yielding base metals like copper and aluminum.
PRICE ACTION
Copper prices fell from ~$13,000 per ton in late February to ~$12,000 per ton on March 20th, as a combination of demand uncertainty, energy-induced inflation risks, and dollar strength weighed on copper prices, sending them to their lowest level in nearly three months.11 However, potential discussions related to conflict de-escalation led copper to recapture some of these losses in late March.
OUTLOOK
While we note persistent uncertainty amidst the war in Iran, demand has been relatively robust as Chinese buyers stepped in amidst recent price declines and the post-Lunar New Year restocking season. Supply issues impacting aluminum shipments via the Strait of Hormuz have also created significant price volatility for copper substitutes, leading to divergent performance for the two metals. This can potentially enhance copper's relative attractiveness, which saw an 8% M-o-M decline versus aluminum's 3.8% advance as of March 23rd.12 Although the environment remains highly volatile, we believe copper's prospects could improve in an early resolution of this conflict.
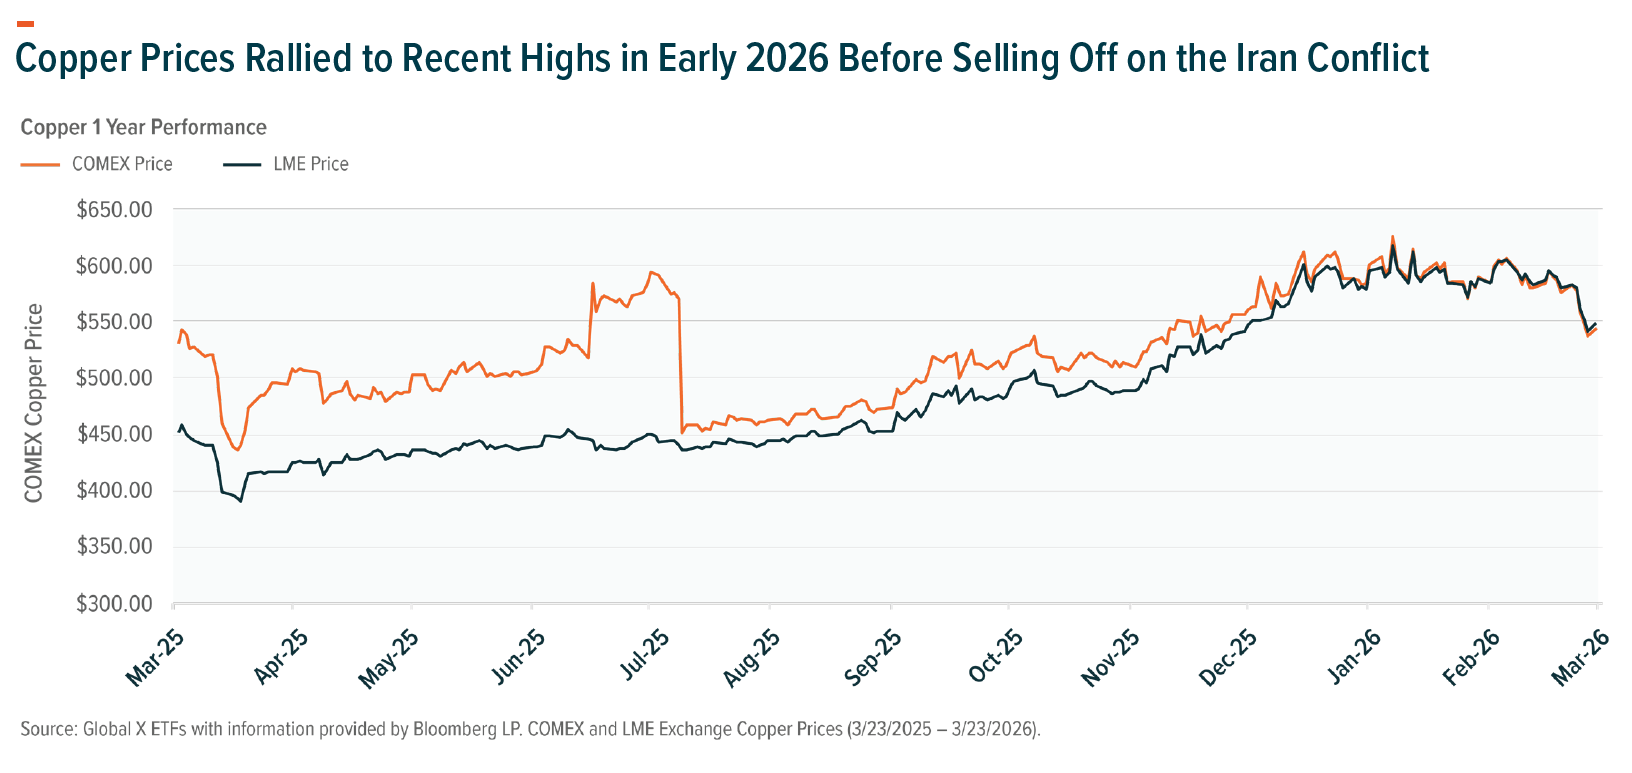
Copper has been weighed down by a combination of growth uncertainties, rising inflation expectations, and persistent dollar strength, which negatively impact metals performance. Despite the price volatility, Chinese copper consumption was robust in March.
Precious Metals
Key Takeaway
Gold and silver offered little respite from market volatility in March, declining alongside stocks and bonds as markets reacted to heightened inflation risks and energy shocks in the Middle East.
Following the attack on Iran, the U.S. dollar rebounded from its steep decline in 2025, weighing on the performance of both precious metals and the emerging markets that mine them. The appreciation in the dollar and corresponding decline in precious metals reflected rising inflation expectations. As of March 20th, U.S. 10-year Treasury yields are now 42 basis points (0.42%) higher since the war broke out on February 28th, impacting the relative value of non-yielding precious metals like gold and silver.13
Turkey's central bank may be preparing to defend the lira by tapping its $135 billion in gold reserves. As a major importer of oil & natural gas, Turkey is vulnerable to energy shocks that exacerbate inflation risks. Turkey's inflation rate last registered 31.5% in February, amongst the highest levels in the world.14 Because the War in Iran has fueled selling of the Lira, Turkish monetary authorities have defended their currency by selling foreign-currency bond holdings and exploring gold-for-foreign currency swap transactions in the London market.15
PRICE ACTION
The war in Iran instigated a reversion of the dollar debasement trade that helped fuel gold's advance in 2025. Since the conflict broke out, gold has declined from ~$5,400 per ounce at the end of February to $4,200 per ounce as of March 23rd.16 The U.S. dollar has appreciated amidst the advance in oil & gas prices, as investors seek safe havens amidst rising inflation concerns and an uncertain economic outlook. The combination of dollar strength, fueled by rising interest rates and investor short covering all weighed on precious metals prices.
OUTLOOK
We think the near-term outlook for precious metals remains largely contingent on the duration of trade disruptions in the Strait of Hormuz. Nevertheless, we think short-term impacts may eventually give way to a meaningful price recovery, should energy prices begin to materially impact global consumption. A weaker global economy could conceivably encourage policy pivots from Central Banks, potentially shifting away from managing price levels toward supporting labor markets. Furthermore, we highlight that the outbreak of war in the Middle East has only served to highlight fundamental gold drivers, including global fragmentation and rising government debt levels.
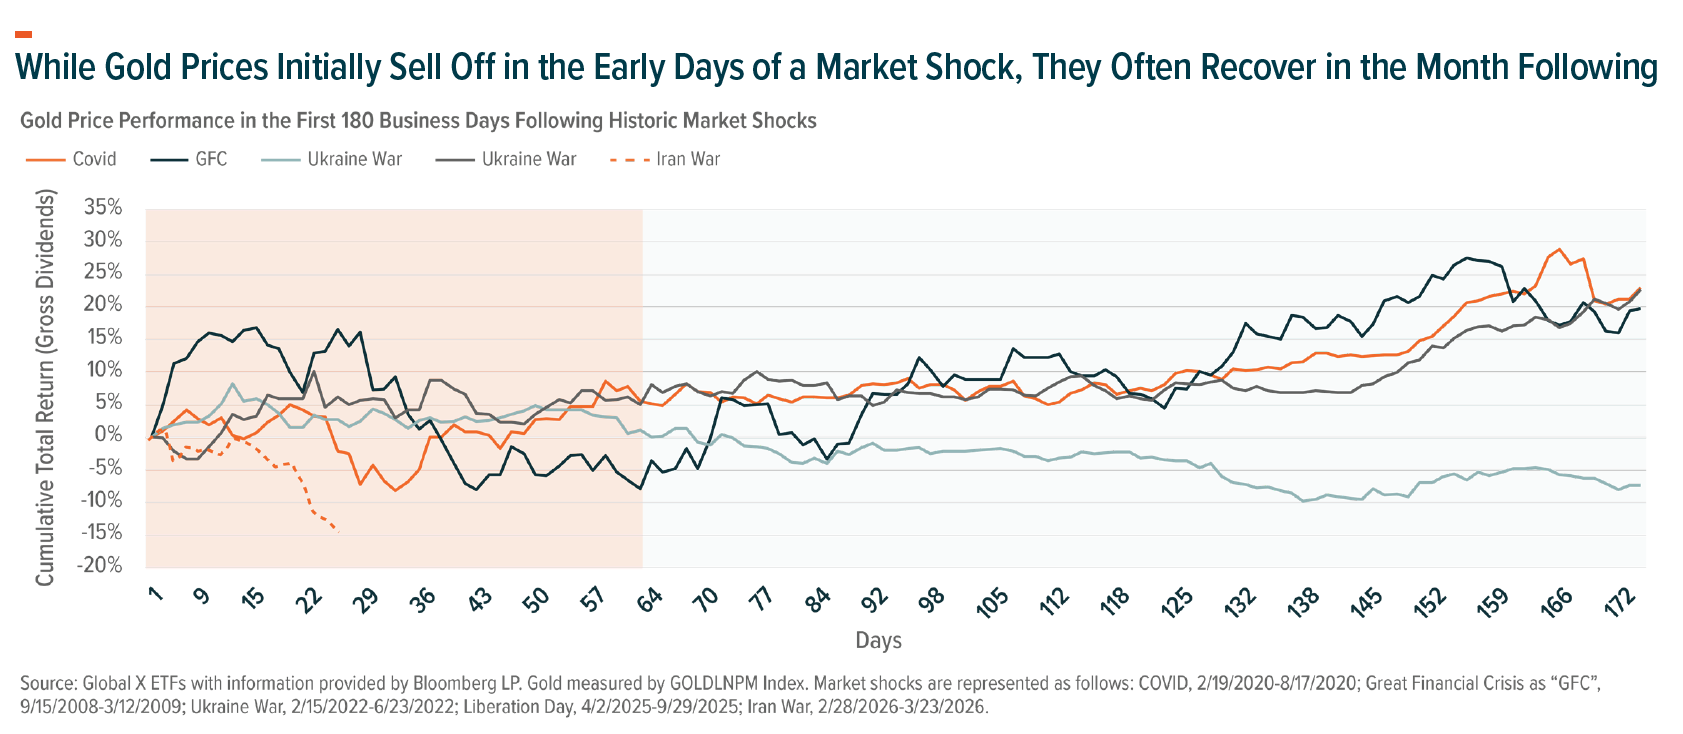
Historically, gold prices have dipped briefly in the initial days following major market shocks but often recover in the months following the initial price decline. An exception was the War in Ukraine which was accompanied by lingering inflation.
Critical Minerals, Battery Tech & Lithium
Key Takeaway
Deal-making momentum across both lithium and rare earths persisted in March, despite heightened volatility perpetuated by the war in Iran. The conflict did not seem to deter governments from diversifying their supply chains and could potentially exacerbate focus on supply chain resilience in the months to come.
South Korean battery manufacturer LG Energy Solution (LGES) signed a $4.3 billion battery electric stationary storage (BESS) cell supply agreement with Tesla. The deal encompasses the production of Lithium iron phosphate (LFP) prismatic cells in Michigan, which will be deployed in Tesla's Megapack 3 system. This marks the latest expansion in a series of newly announced LFP deals coming online in the United States.17
The U.S. and Japanese governments released a joint statement on coordinating trade policies that could include a border-adjusted price floor mechanism to support supply chains and the production of critical minerals, such as rare earths.18 According to the U.S. Trade Representative's office, Japan and the U.S. will work to identify specific critical mineral projects for priority policy and financing support. Companies like Albemarle and Mitsubishi Materials have already reported potential discussions for international investment under this framework.19
PRICE ACTION
Lithium prices fluctuated in the month of March, with the Iranian conflict heightening uncertainty around regional EV and BESS sales. Lackluster global EV sales from February and fears of heightened inflation may encourage cautious activity from traders in the near term. In rare earths, global markets continue to bifurcate, with North American dysprosium prices rising to a 4.4X premium relative to EXW China prices. Benchmark Rare Earths Service expects that differential to nearly double to 8.3X by 2027, highlighting a continued divergence in global magnet supply chains vs. China, where geopolitical risks have increasingly dominated the narrative.20
OUTLOOK
Despite their volatility, lithium prices remain positive year-to-date, reflecting robust fundamentals and lingering tightness in mined output following last year’s CATL mine pause. Going forward, we believe both Europe and the United States may lead policy decisions to diversify critical mineral suppliers and processing capacity. The closure of theStrait of Hormuz elevates the importance of supply chain resilience while continued demand for rare earths from military and industrial buyers may persist amidst the proliferation of geopolitical risks.
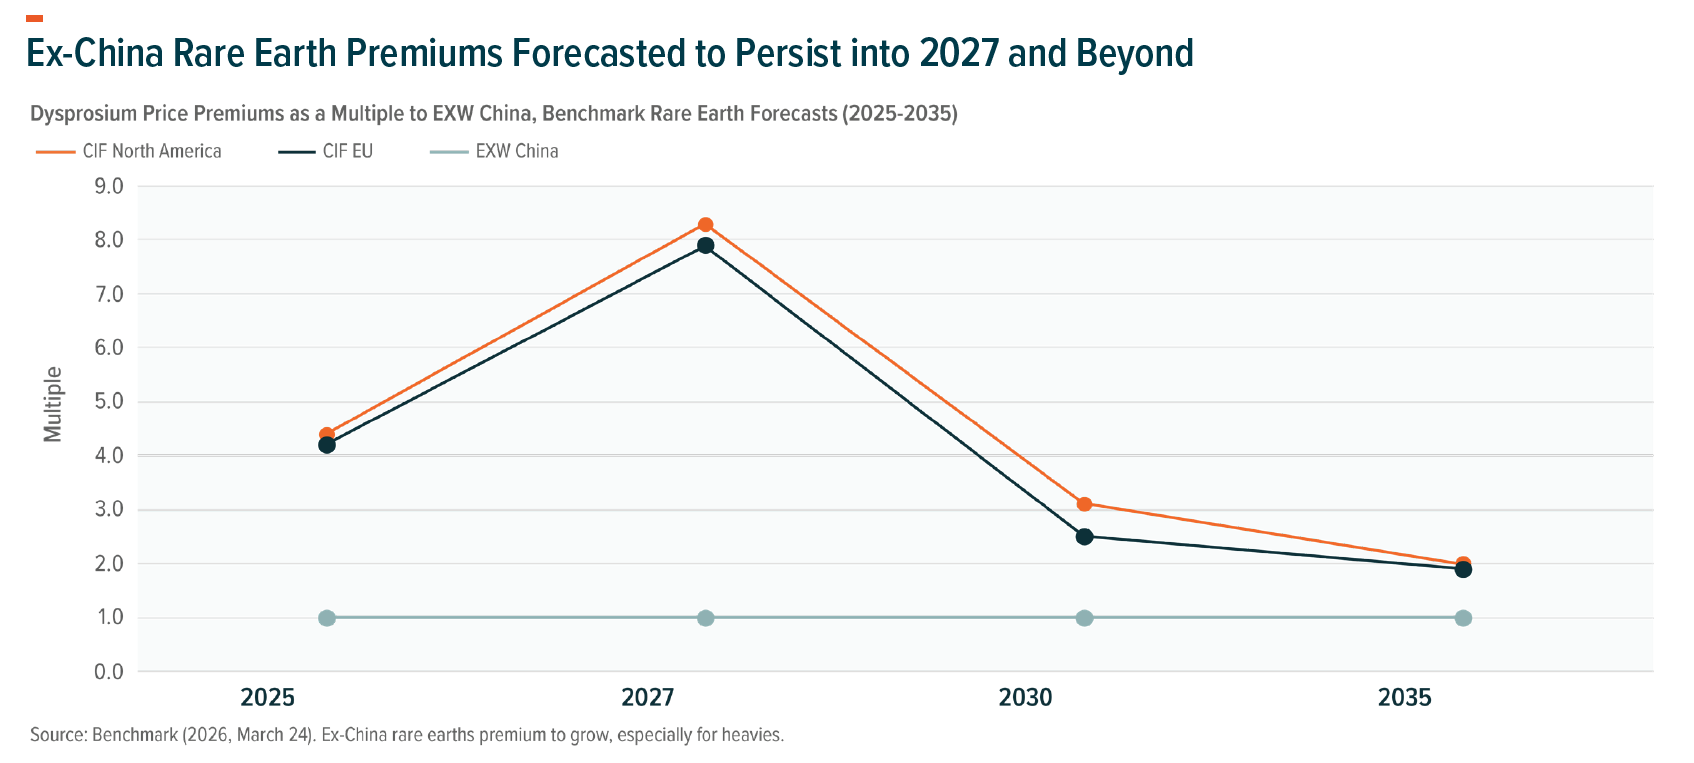
Chinese export controls on rare earth metals have bifurcated global markets, tightening supply chains and raising input costs across regions like Europe and North America.
Related ETFs
COPX – Global X Copper Miners ETF
SIL – Global X Silver Miners ETF
EART – Global X Rare Earth & Critical Materials ETF
AUAU – Global X Gold Miners ETF
LIT – Global X Lithium & Battery Tech ETF
2646 – Global X Japan Metal Business ETF
424A – Global X Gold ETF (JPY Hedged)
578A – Global X Silver ETF (JPY Hedged)
579A – Global X Silver Miners ETF
580A – Global X Copper Miners ETF
609A – Global X Japan Wholesale Trade & Resource Business ETF
Click the fund name above to view current performance and holdings. Holdings are subject to change. Current and future holdings are subject to risk.
