Inflection Points: The Best Defense Is a Good Offense

Fresh off the University of Michigan’s National Championship victory (Go Blue!), football is still top of mind as I assess market trends at the start of 2024. In early January, investor sentiment slid towards defensive assets amid growing wariness of economic conditions and potentially stretched valuations.1 This could turn out to be a head fake. In my view, the old sports adage may be appropriate for portfolios in this market environment: The best defense is a good offense.
We remain optimistic even as we expect U.S. economic growth to slow and rates to remain higher than consensus forecasts.2 While slowing growth plus higher rates does not seem like cause for celebration, this combination may speak to an environment supported by a healthy labor market, stronger-than-expected consumers, and a soft landing for the economy.3 Against that backdrop, we believe investors can play defense by finding cheaper parts of the market that continue to deliver growth with strong fundamental performance.
Key Takeaways
- Returns on major equity indexes were strong in 2023, but two-year S&P 500 performance is almost flat, and a shift to defensive equity positioning may not be the best strategy in a slowing economy.
- Major index valuations may be elevated, but multiples go up over time as profit margins improve on technological innovation and greater efficiency.
- Pockets of opportunity are possible in themes that lagged the broader market despite superior earnings growth and margin improvement over the past two years.
Just About Even at Halftime
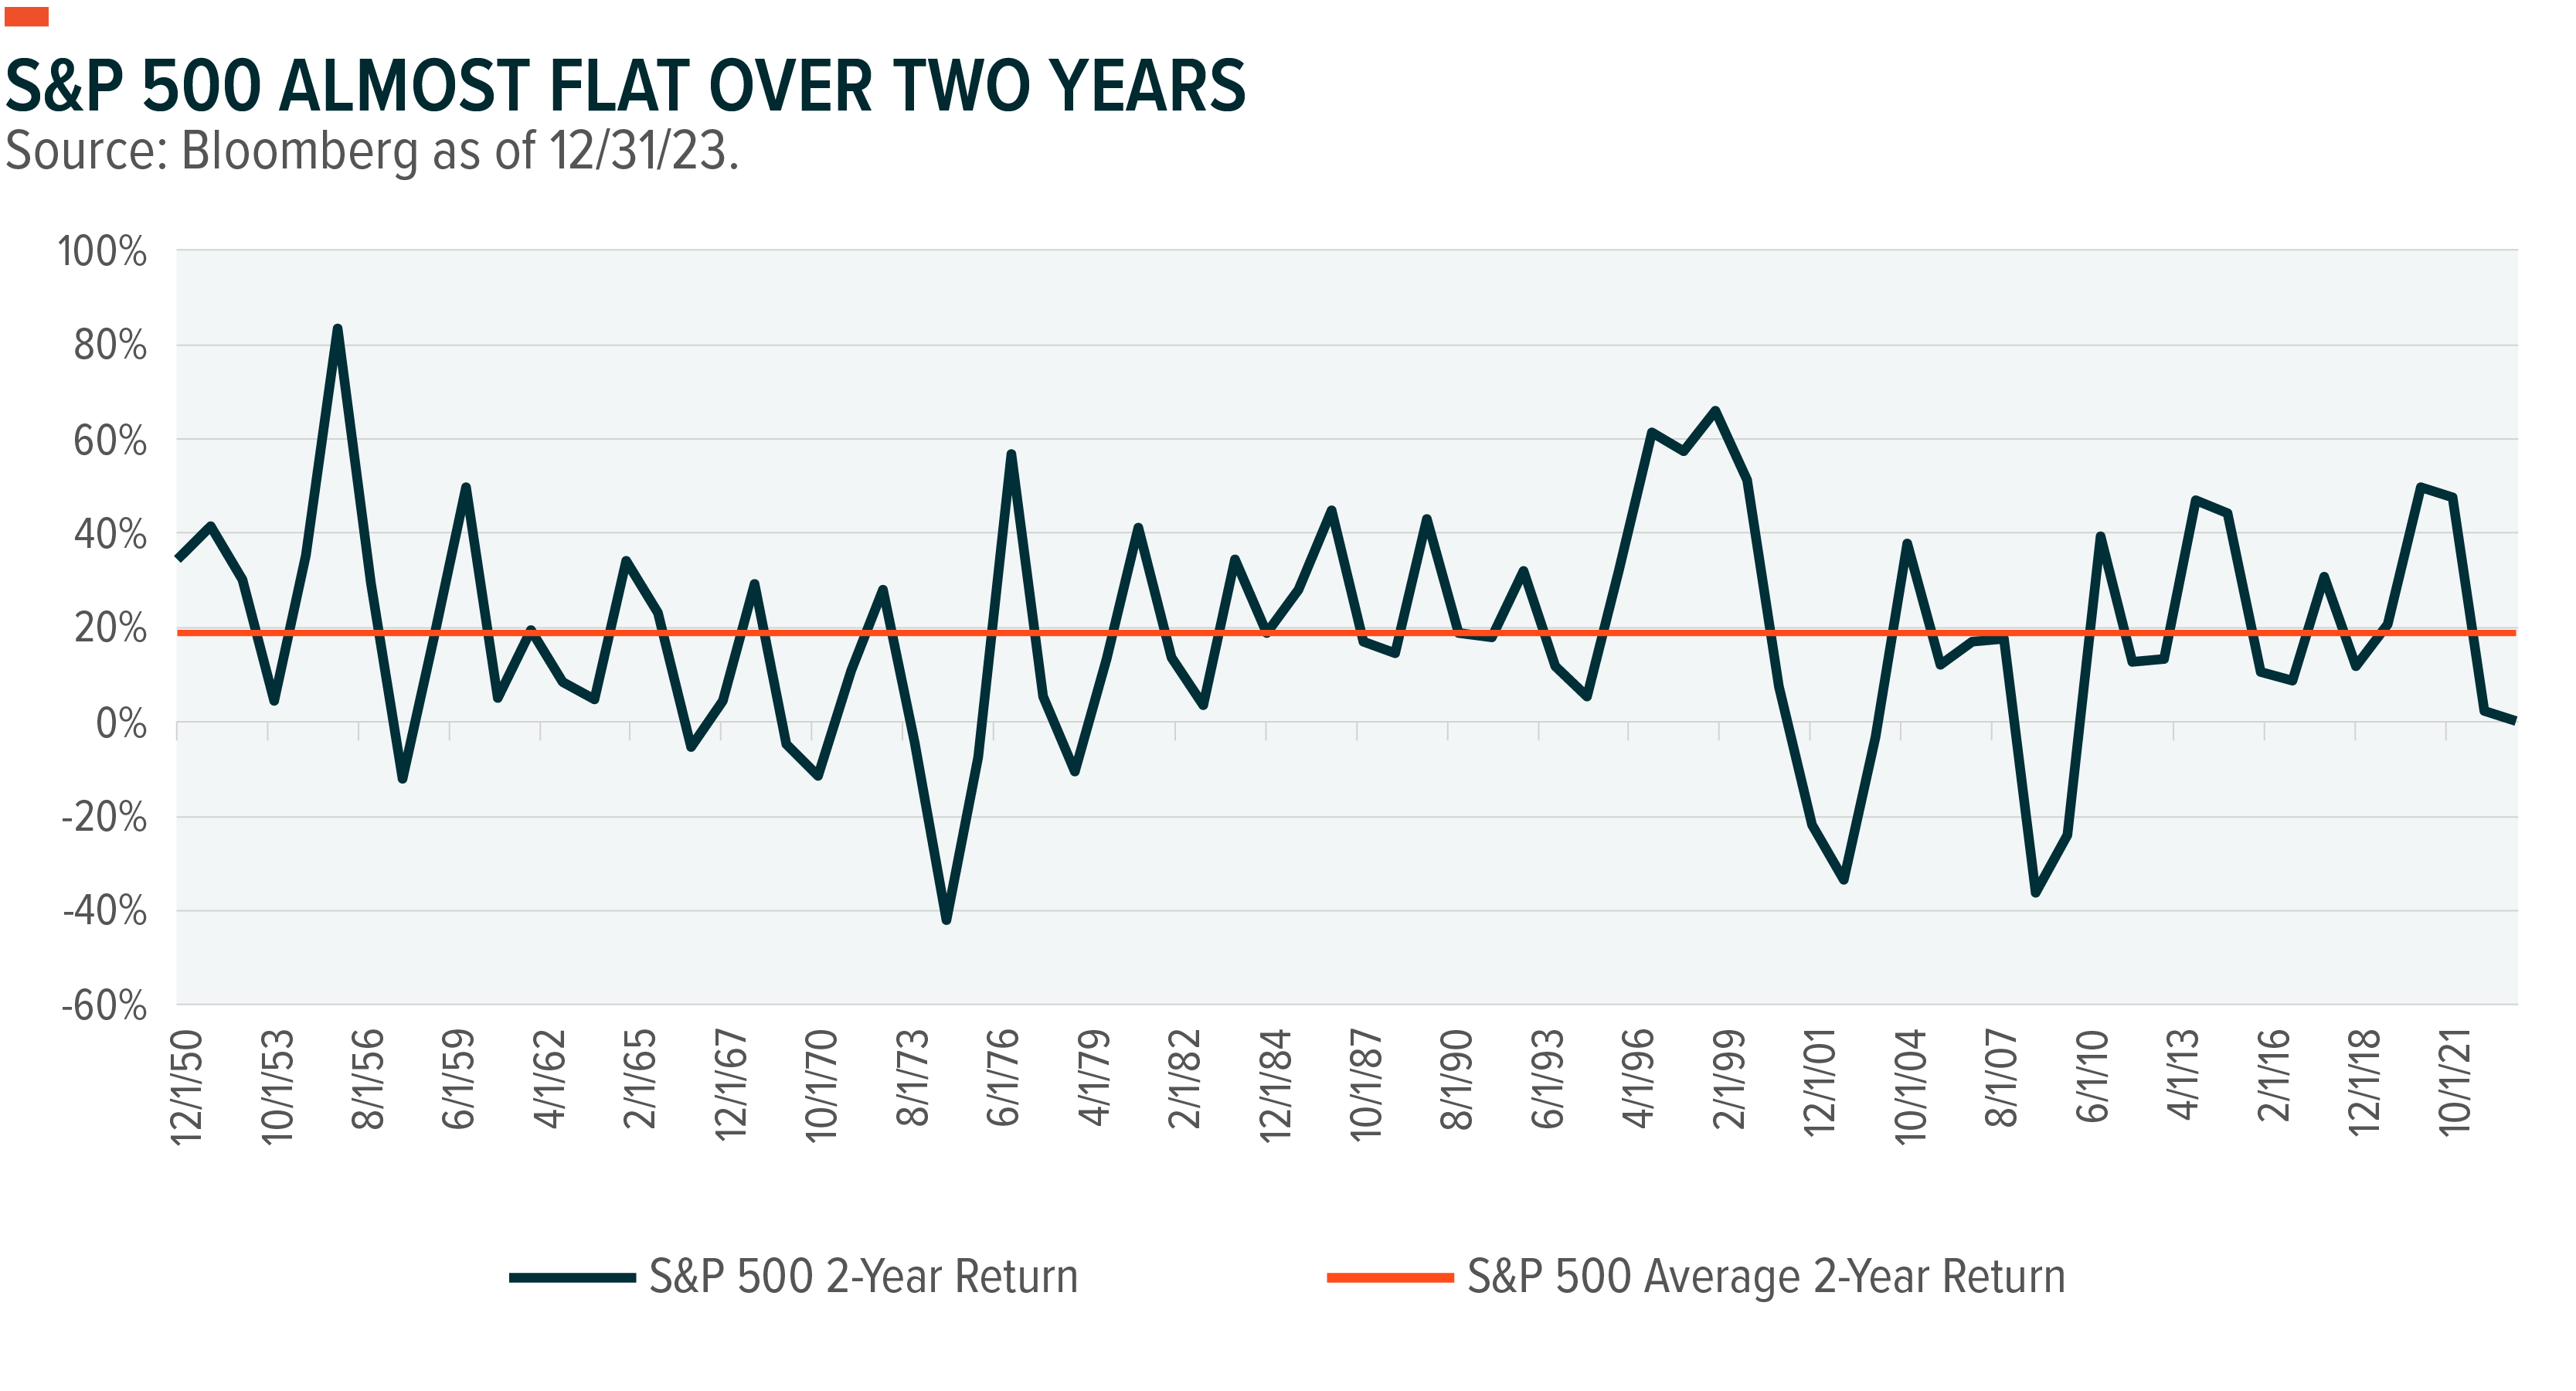
After a rough go in 2022, U.S. equity markets had a pretty good year in 2023. Stocks, though, rarely sell off more than 20% two years in a row. Only three times since 1950 have stocks recorded double-digit back-to-back declines. Most selloffs are reversed in a matter of months.4
Currently, U.S. real GDP growth is forecast to decline from 2.4% in 2023 to 1.3% in 2024, with the worst of the slowdown, sub-1% growth, now not expected until Q3 and Q4.5 While a coveted soft landing seems to be the consensus expectation, there is concern that equity valuations are too lofty after the 19% gain in the S&P 500 last year. The irony is that markets are just regaining their lost ground from 2022.6 The two-year price appreciation for the S&P 500 is just 0.1% (see chart). Even the rip-roaring, Magnificent 7-heavy Nasdaq 100 is only up 3% since 2021.
Despite these somewhat muted returns, investors turned their attention to defensive sectors in the first couple weeks of the year. Utility sector ETFs gained $255 million, or 1.1% of assets under management (AUM).7 Healthcare ETFs received the largest inflows of $810 million, or 0.8% of AUM. Consumer Discretionary, out of favor given concerns about a labor slowdown and headwinds from inflation, continued to face challenges with sector ETFs losing a hefty $784 million, or 2.3% of AUM.
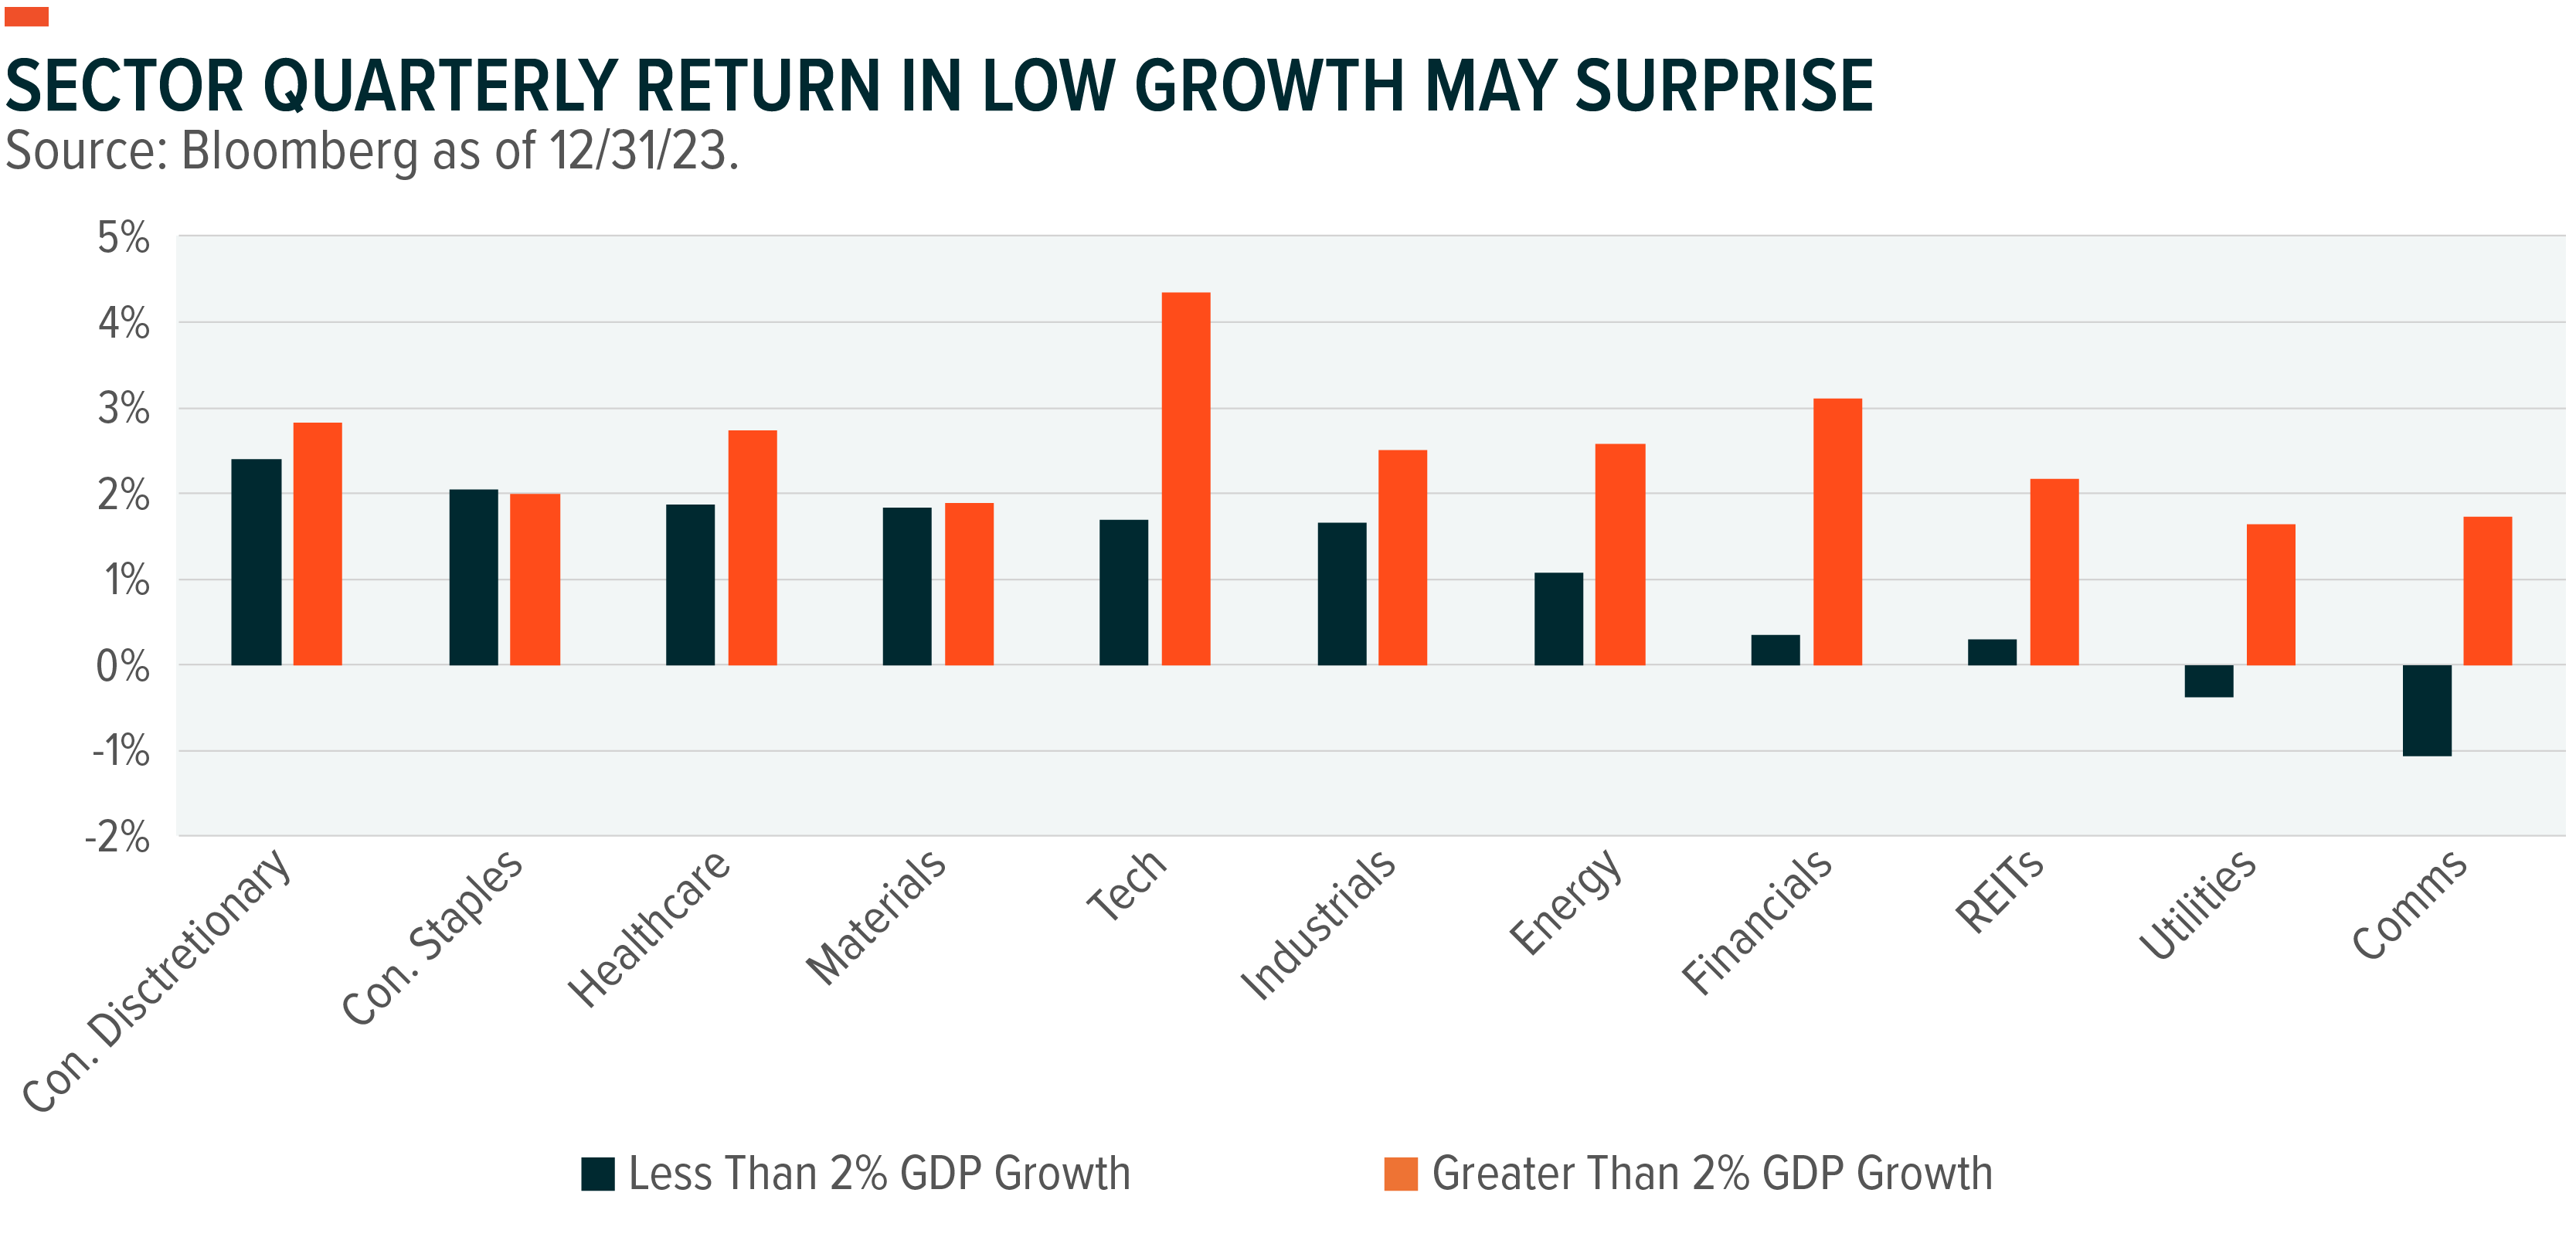
Perhaps counterintuitively, these defensive stances may not be the best strategy in a slowing economy. When the economy slows, Utilities and Communication Services (the old Telecom sector), are the worst-performing sectors on average, despite being considered defensive.8 Consumer sectors hold up better. Discretionary delivers the highest average return with GDP growth below 2%, followed by Staples and Healthcare. Interestingly, Materials, Tech, and Industrials, typically viewed as outperformers in strong economic expansions, also do relatively well with slow growth on average.
Think Valuations Are Pinned Against a Goal Line? Think Again
Valuation may not justify a defensive turn and investors might want to tread carefully. The S&P 500 is at a price-earnings ratio of 22x 2024 earnings, which is below 23x in December 2021, but above the long-term average of 18.7x.9
At some point during any given cycle, equity valuations seem range bound, but that’s not the case when we zoom out. Valuations reflect expectations of future growth and profitability, and over time, profit margins march higher (see chart).10 For example, S&P 500 profit margins averaged 6.2% from 1950 to 1955. From 2018 to 2023, profit margins averaged 9.8%. Historically, companies get more efficient over time with better use of capital, labor, and technology. Corporate investment and innovation in areas like AI and automation may help explain the relative resilience of this economic cycle.
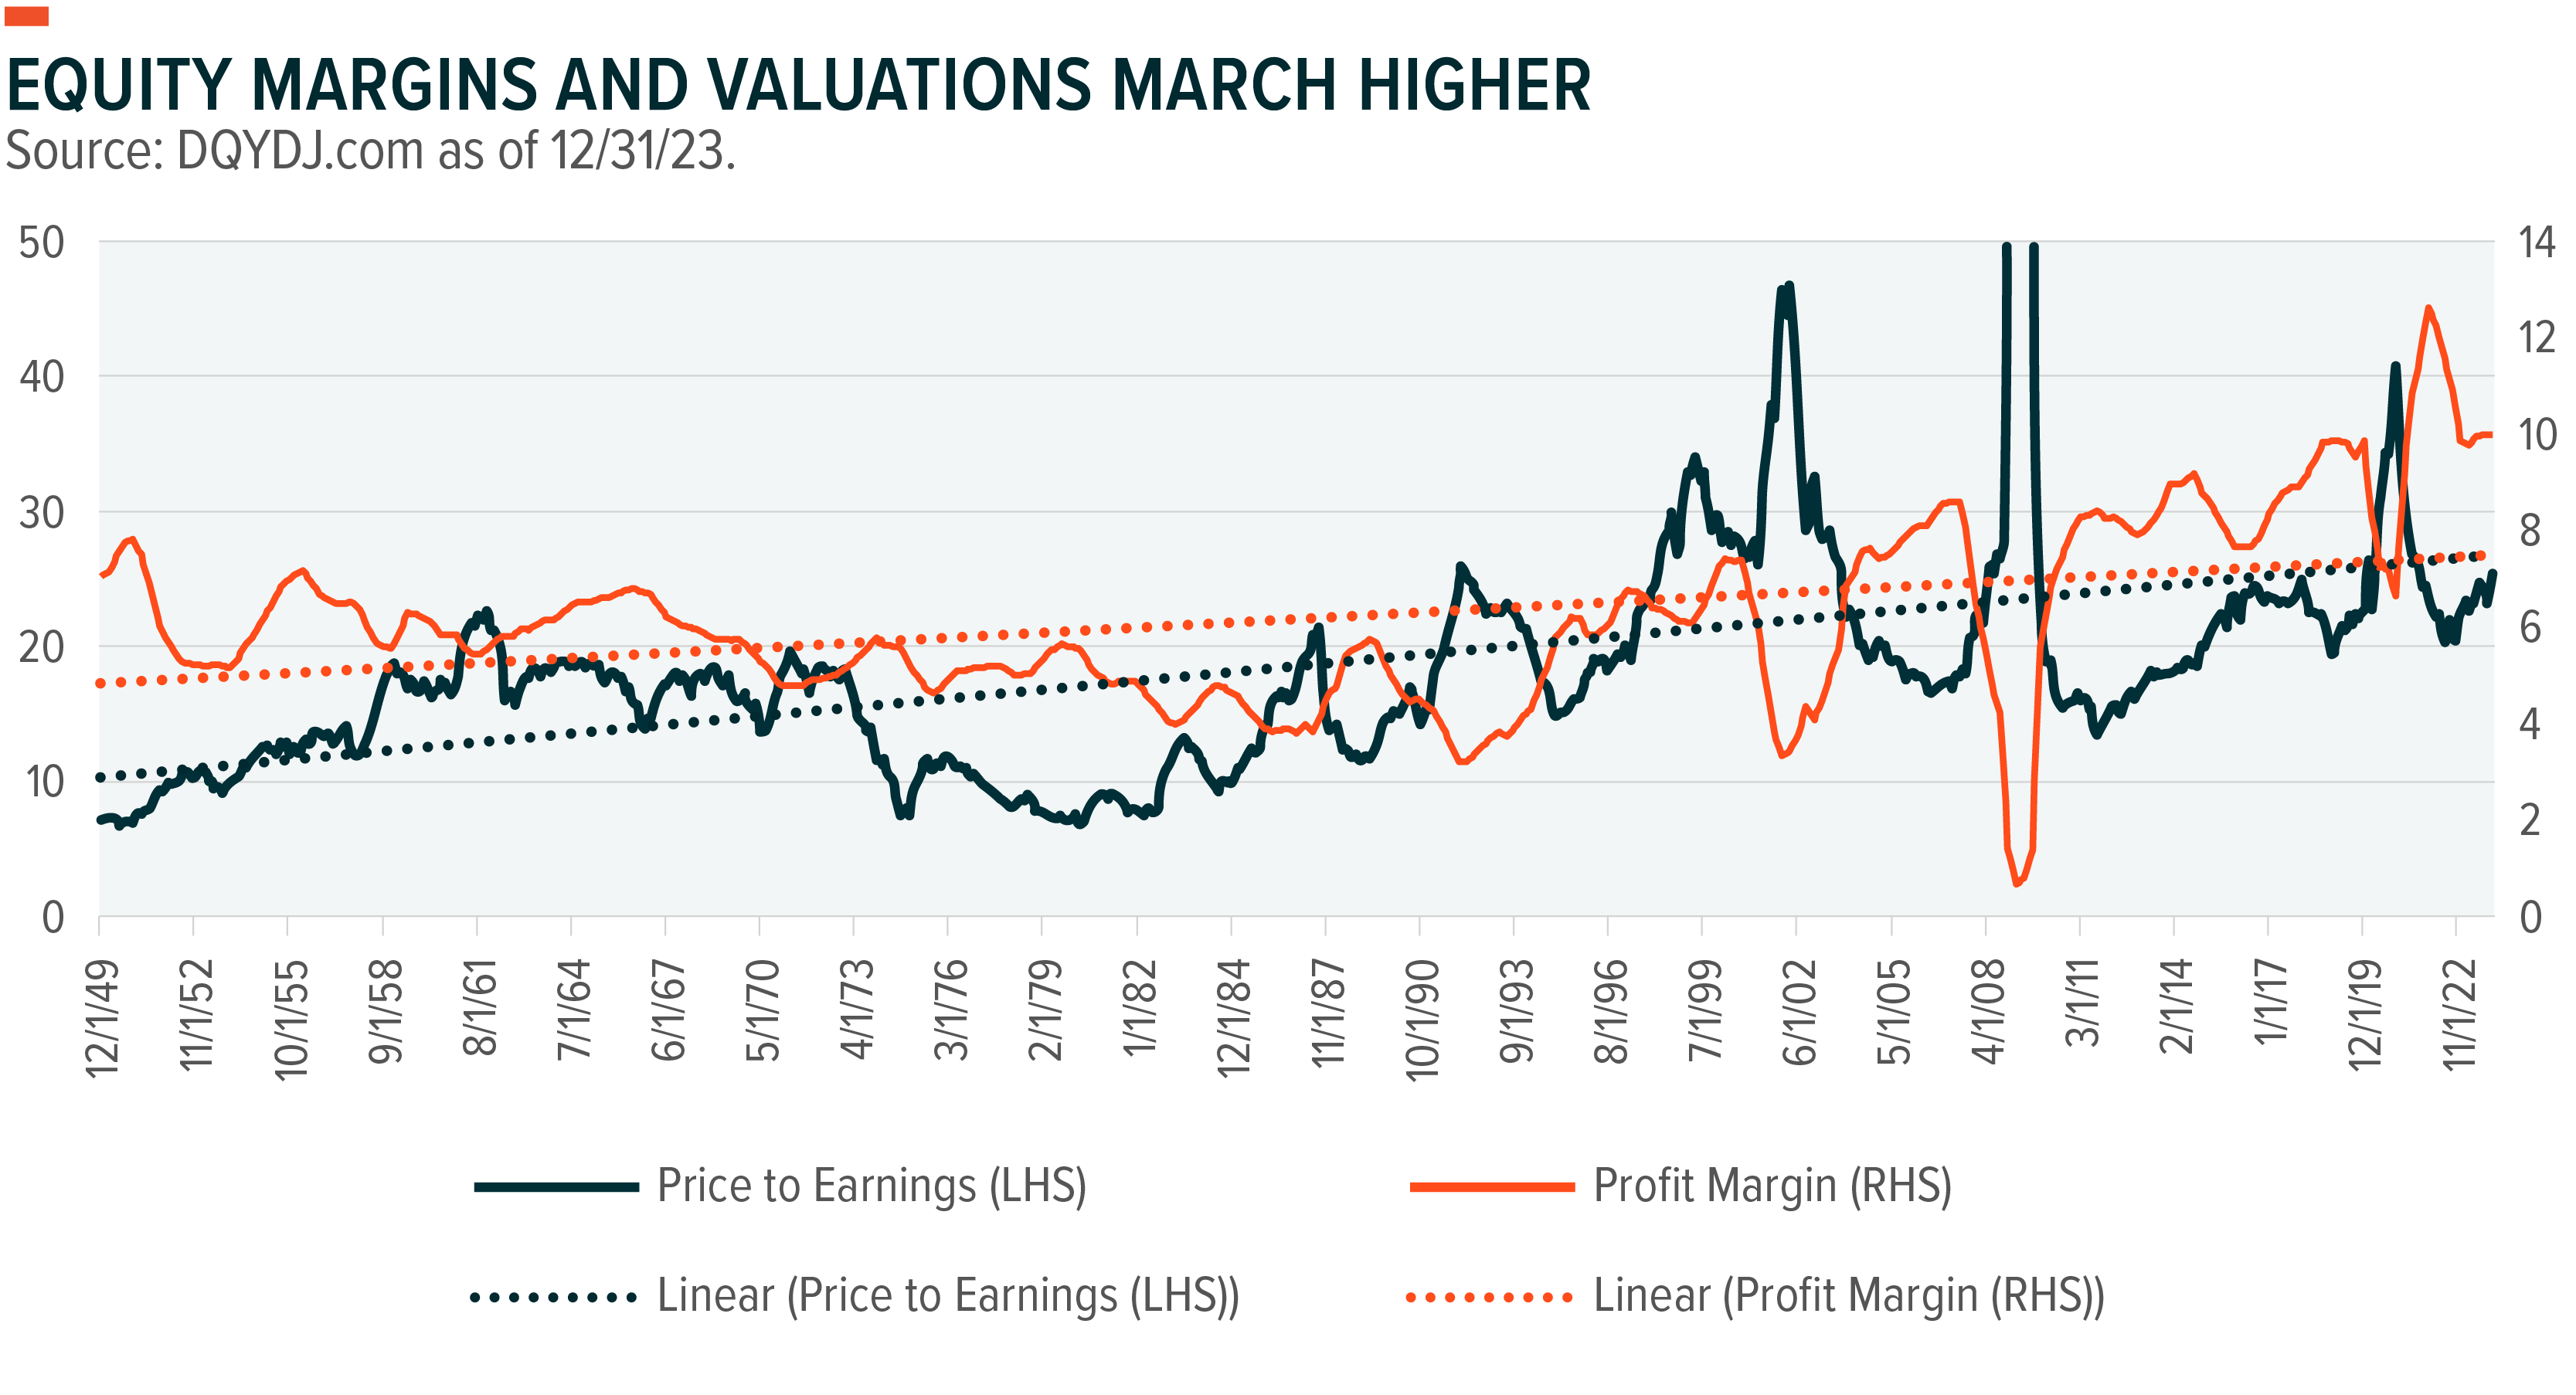
Many factors determine valuations, but with profit margins moving higher over the past 70 years, and valuations tied to margins, it is reasonable to expect valuations could move higher from here. Comparing current valuations to simple long-term averages, does not account for these differences in growth and margins. Just following a linear trend, the multiple for the S&P 500 would expand from 10x in 1950 to almost 27x in 2024.11 This exercise is only intellectual, and not an assessment of reasonable valuation, but the linear regression does highlight the risk of assuming things remain equal in a dynamically changing economy.
Keep the Ball Moving with a Thematic Playbook
Cautious investing is warranted given all the uncertainty in this environment, but factors potentially driving investor reticence are worth reconsidering. First, equities go up over long periods of time, they don’t revert to the mean. Second, stock valuations can remain extended for protracted periods of time, and they tend to slowly move higher over time.12 Third, many companies and themes did not fully participate in the 2023 rally that favored the Magnificent 7, so as market breadth improves, some themes may be poised to catch up.
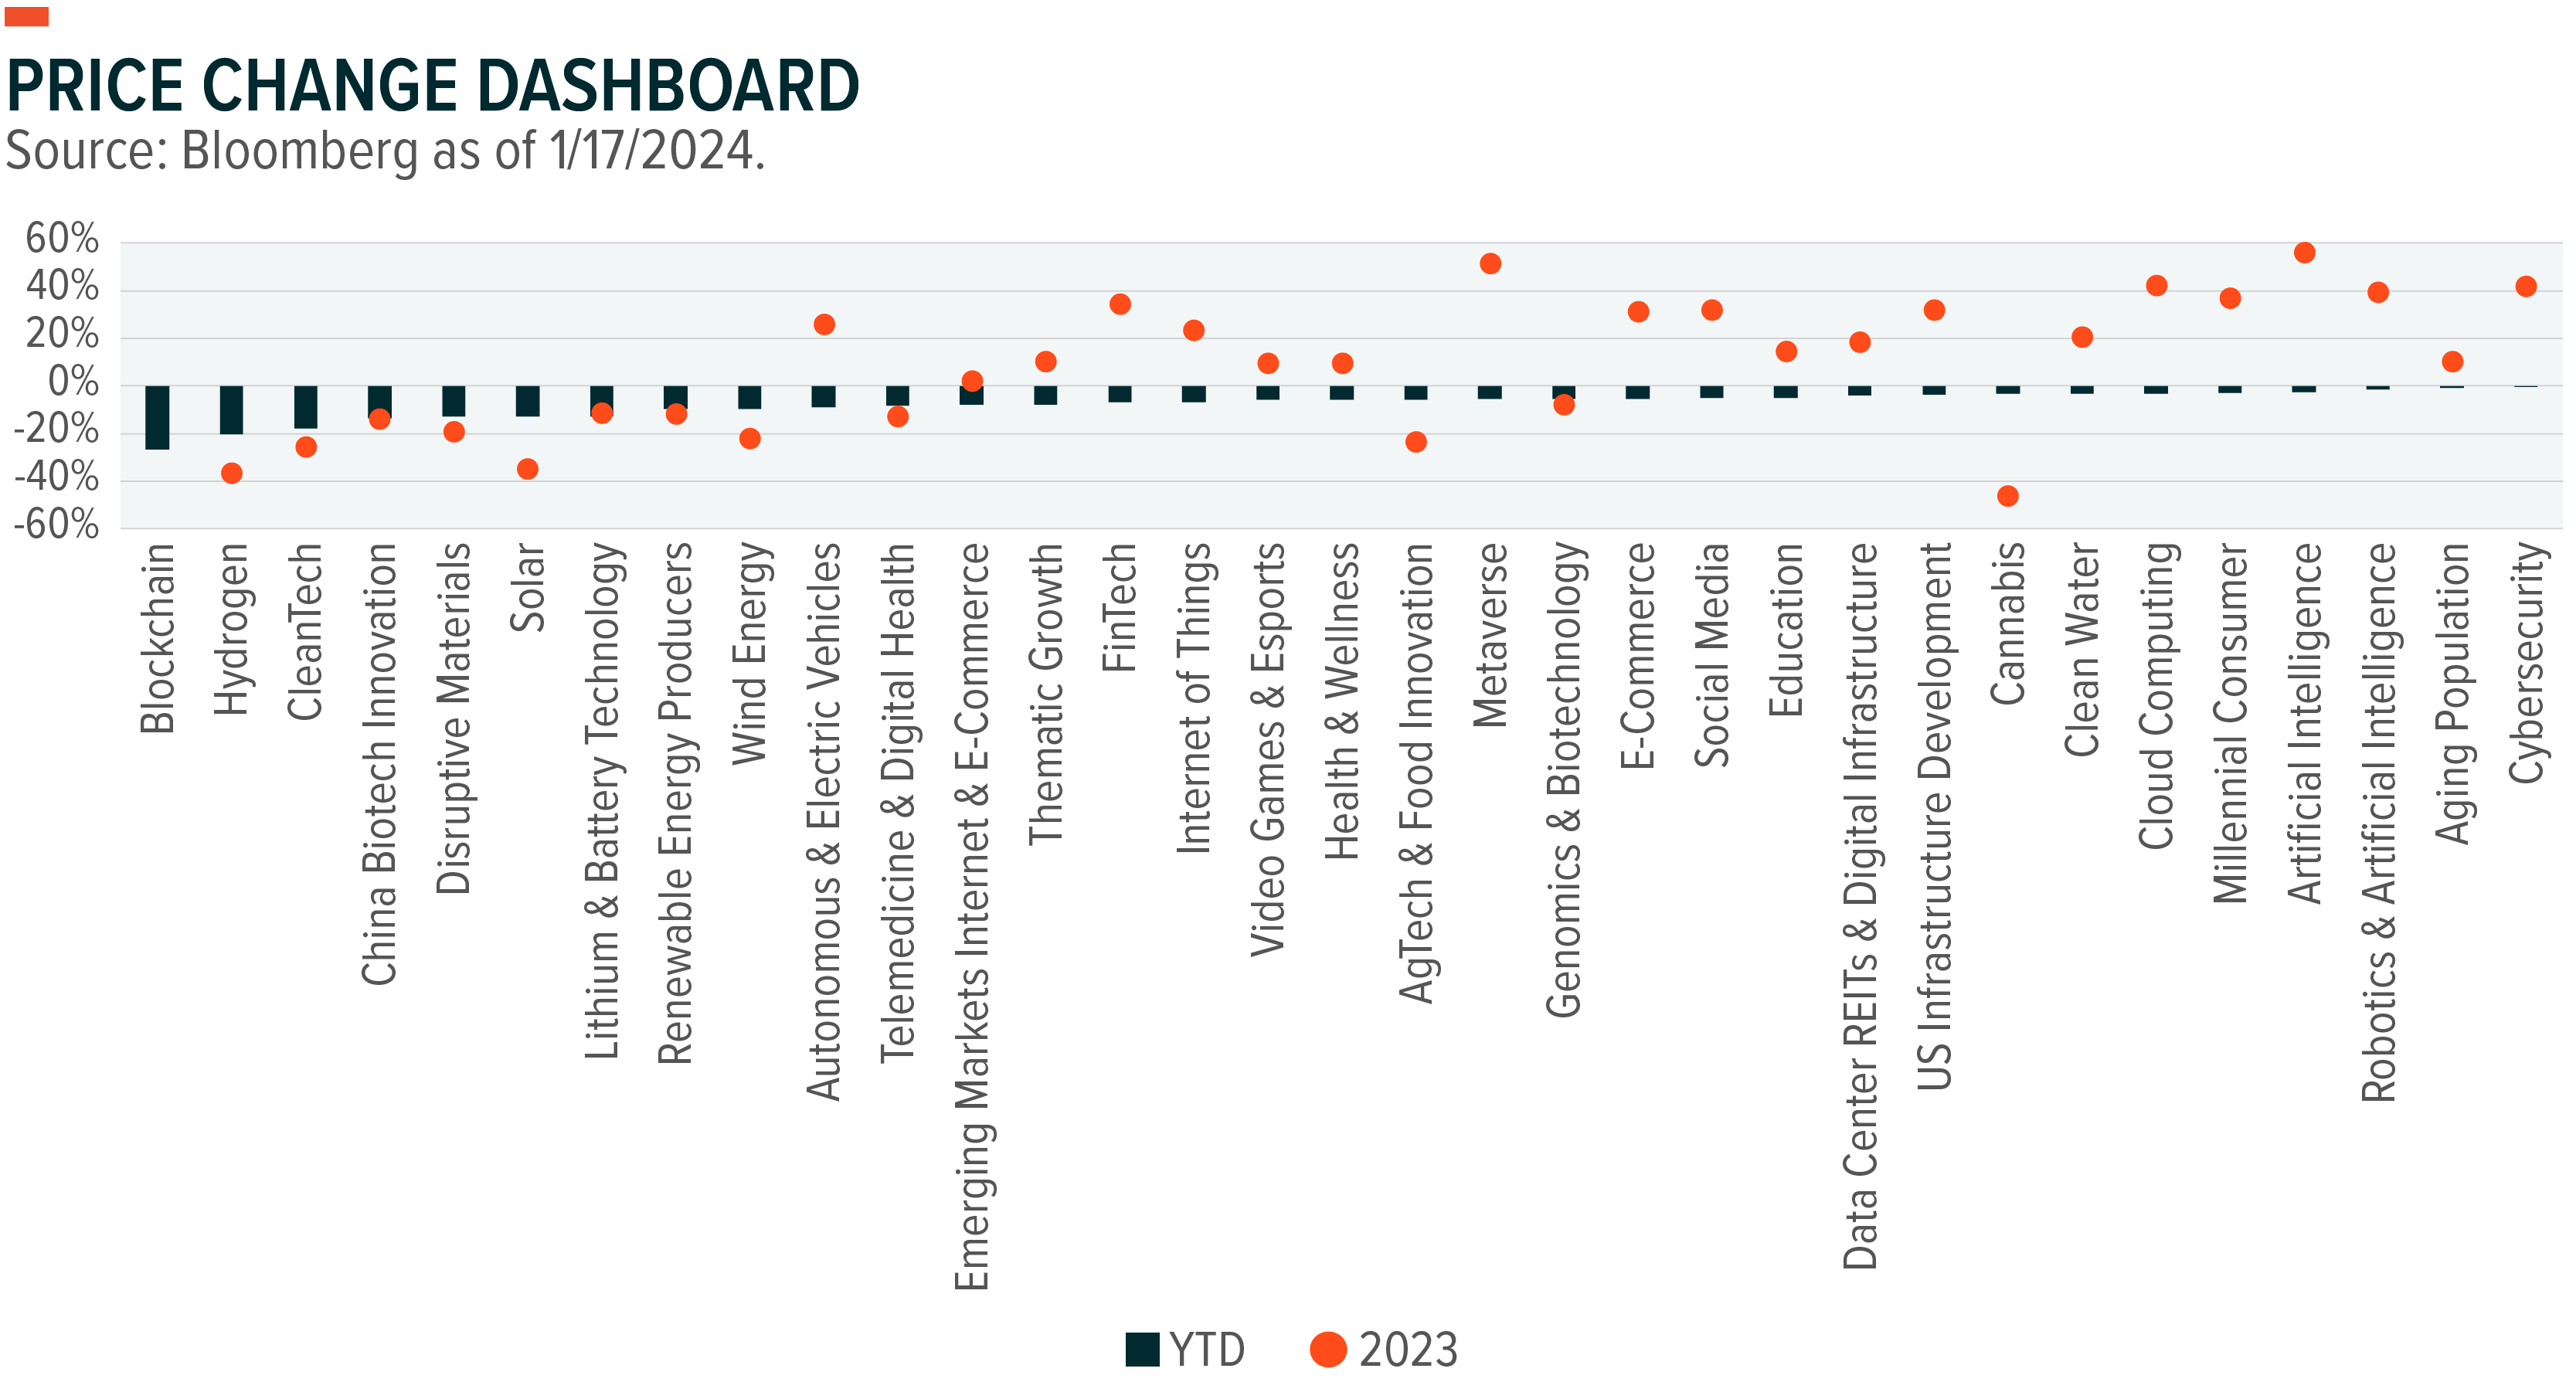
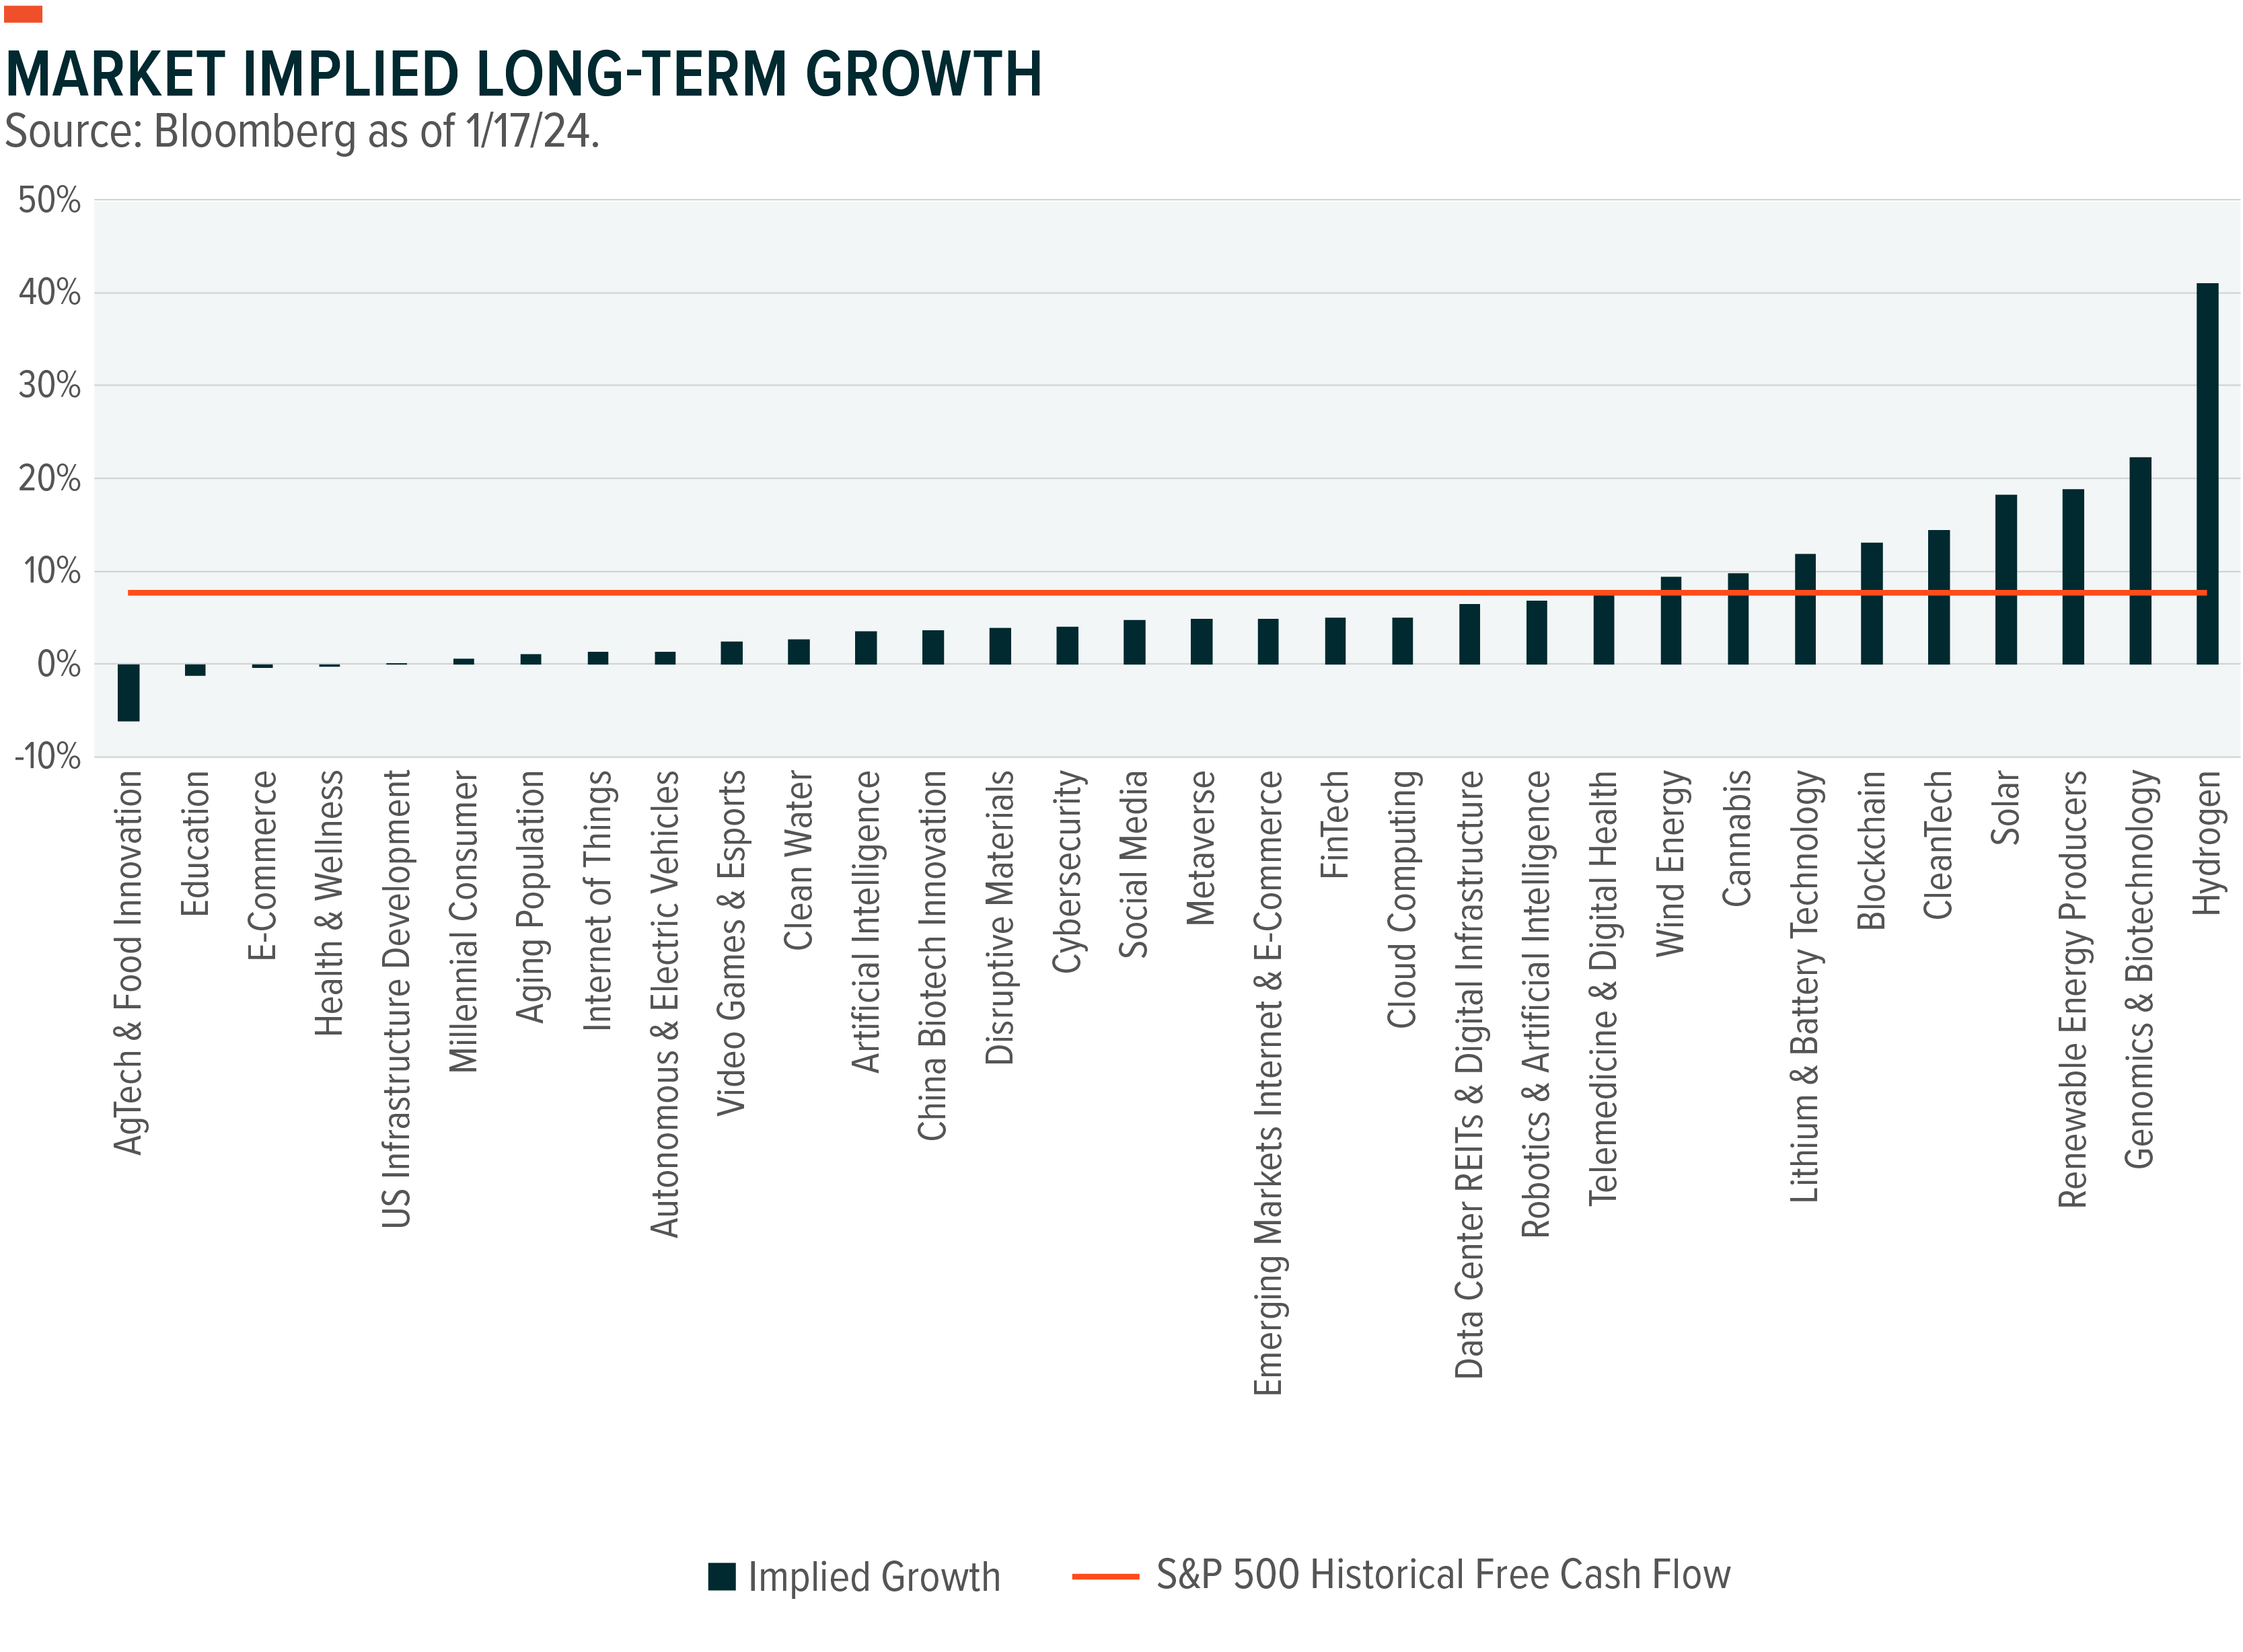
Over the past two years, the S&P 500 earnings grew by 9% and profit margins contracted by about 1%.13 That said, themes with companies that are grew earnings faster than the S&P 500 over the past two years, while incrementally improving margins may be worthy of attention, particularly if those themes have not appreciated in line with the broader market (see chart).
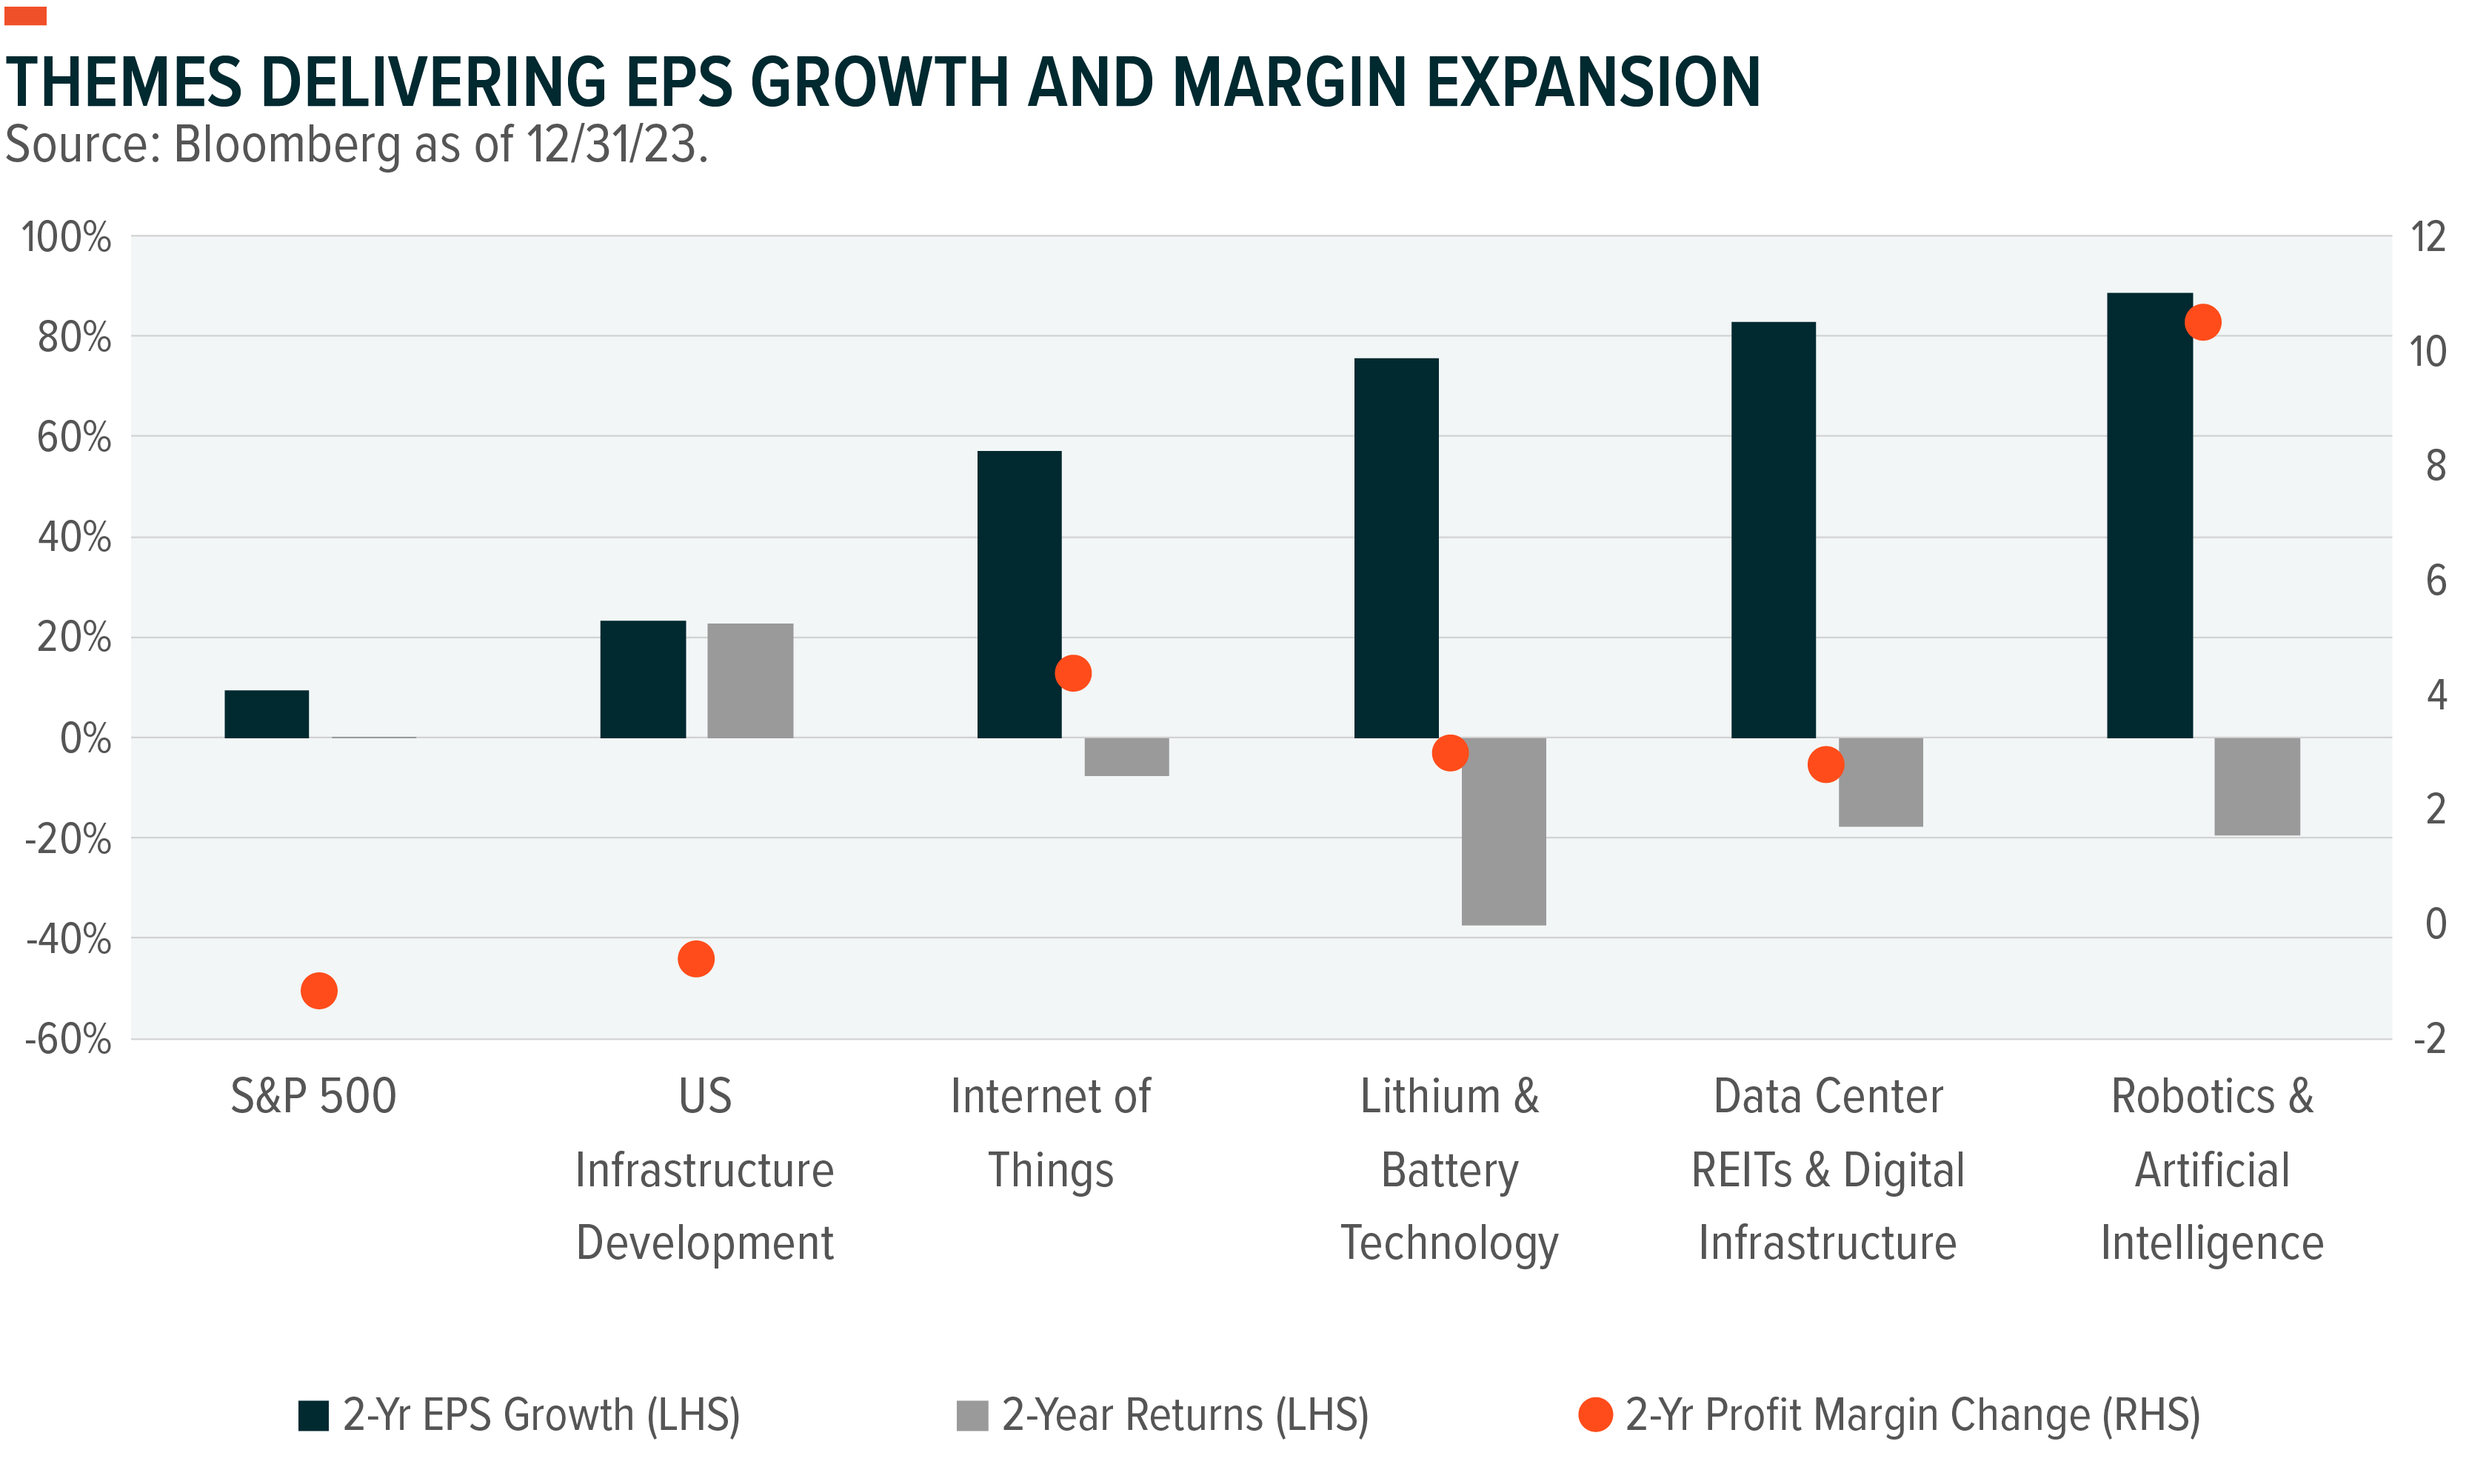
Five of the 30 themes that we track regularly managed to beat the S&P 500 on earnings growth and margin improvement. Robotics & Artificial Intelligence was a standout, delivering fundamentals to match the hype. Company earnings grew more than 80% over two years, well in excess of the broader market, while profit margins also expanded by 10%.14 Despite this operating improvement and strong 2023 returns, two-year performance is still -20%. Internet of Things connected devices also had earnings and profit margins that outpaced the S&P 500 with two-year returns lagging.
Three additional themes, Data Center REITS and Digital Infrastructure, tied to AI and increased digitalization, along with Lithium & Battery Technology, had strong earnings growth with less margin contraction than the S&P 500.15 Both themes underperformed the S&P 500 on a 2-year basis. The one theme that beat the broad index was U.S. Infrastructure, which still has a P/E multiple below the S&P 500 and remains positioned to benefit from geopolitical conditions.
Chasing a rally can be nerve-wracking and imprudent. The same can be said for underinvesting in risk and growth assets in a relatively sound economy. A lot of cash remains on the sidelines in money markets, and much of that cash will be deployed in equities and fixed income over time. Identifying themes with superior operating fundamentals that decoupled somewhat from the broad market last year may offer a chance to remain on offense while mitigating the cost of buying in at a higher entry point.
Themes with potential for continued growth and operating efficiency tied to secular transformations like AI, automation, and increased geopolitical uncertainty can be a particularly attractive play call in this environment.
Inflection Point Theme Dashboard
