
Divergence in U.S. Banks: Exploring Resilience in Global Systemically Important Banks (Part I)
This year’s turbulence in the banking sector began with the collapse of Silicon Valley Bank in March, setting the stage for subsequent regional bank failures, including notable cases like First Republic. As a result, the three major rating agencies initiated a wave of downgrades during the summer, reigniting concerns about the overall health of the sector. Markets are also bracing for a prolonged period of elevated interest rates. These challenges have introduced a sense of uncertainty, particularly given the contrasting strength of the largest U.S. banks in relation to the conversation about regional banks.
In this dynamic landscape, Global Systemically Important Banks (G-SIBs) have displayed remarkable resilience when contrasted with their smaller counterparts. This piece will delve into the factors underpinning the sustained strength of G-SIBs, examining crucial aspects like tier 1 capital ratios, positive results from the Fed stress tests, and the robustness of their balance sheets. Additionally, the second part of this blog series will explore the potential advantages of investing in their preferred shares over other available investment avenues.
This discussion is divided into two parts. The first part will focus on the banking sector developments, and the second part will explore investment opportunities as well as why preferred stock may stand out as a compelling option for investors.
Key Takeaways
- Recent downgrades to the operating environment, exacerbated by proposed long-term debt (LTD) requirements, may subject the more speculative credits to higher borrowing costs, potentially squeezing profit margins. While G-SIBs are not immune from downgrades, the regulatory risks remain largely isolated to regional banks.
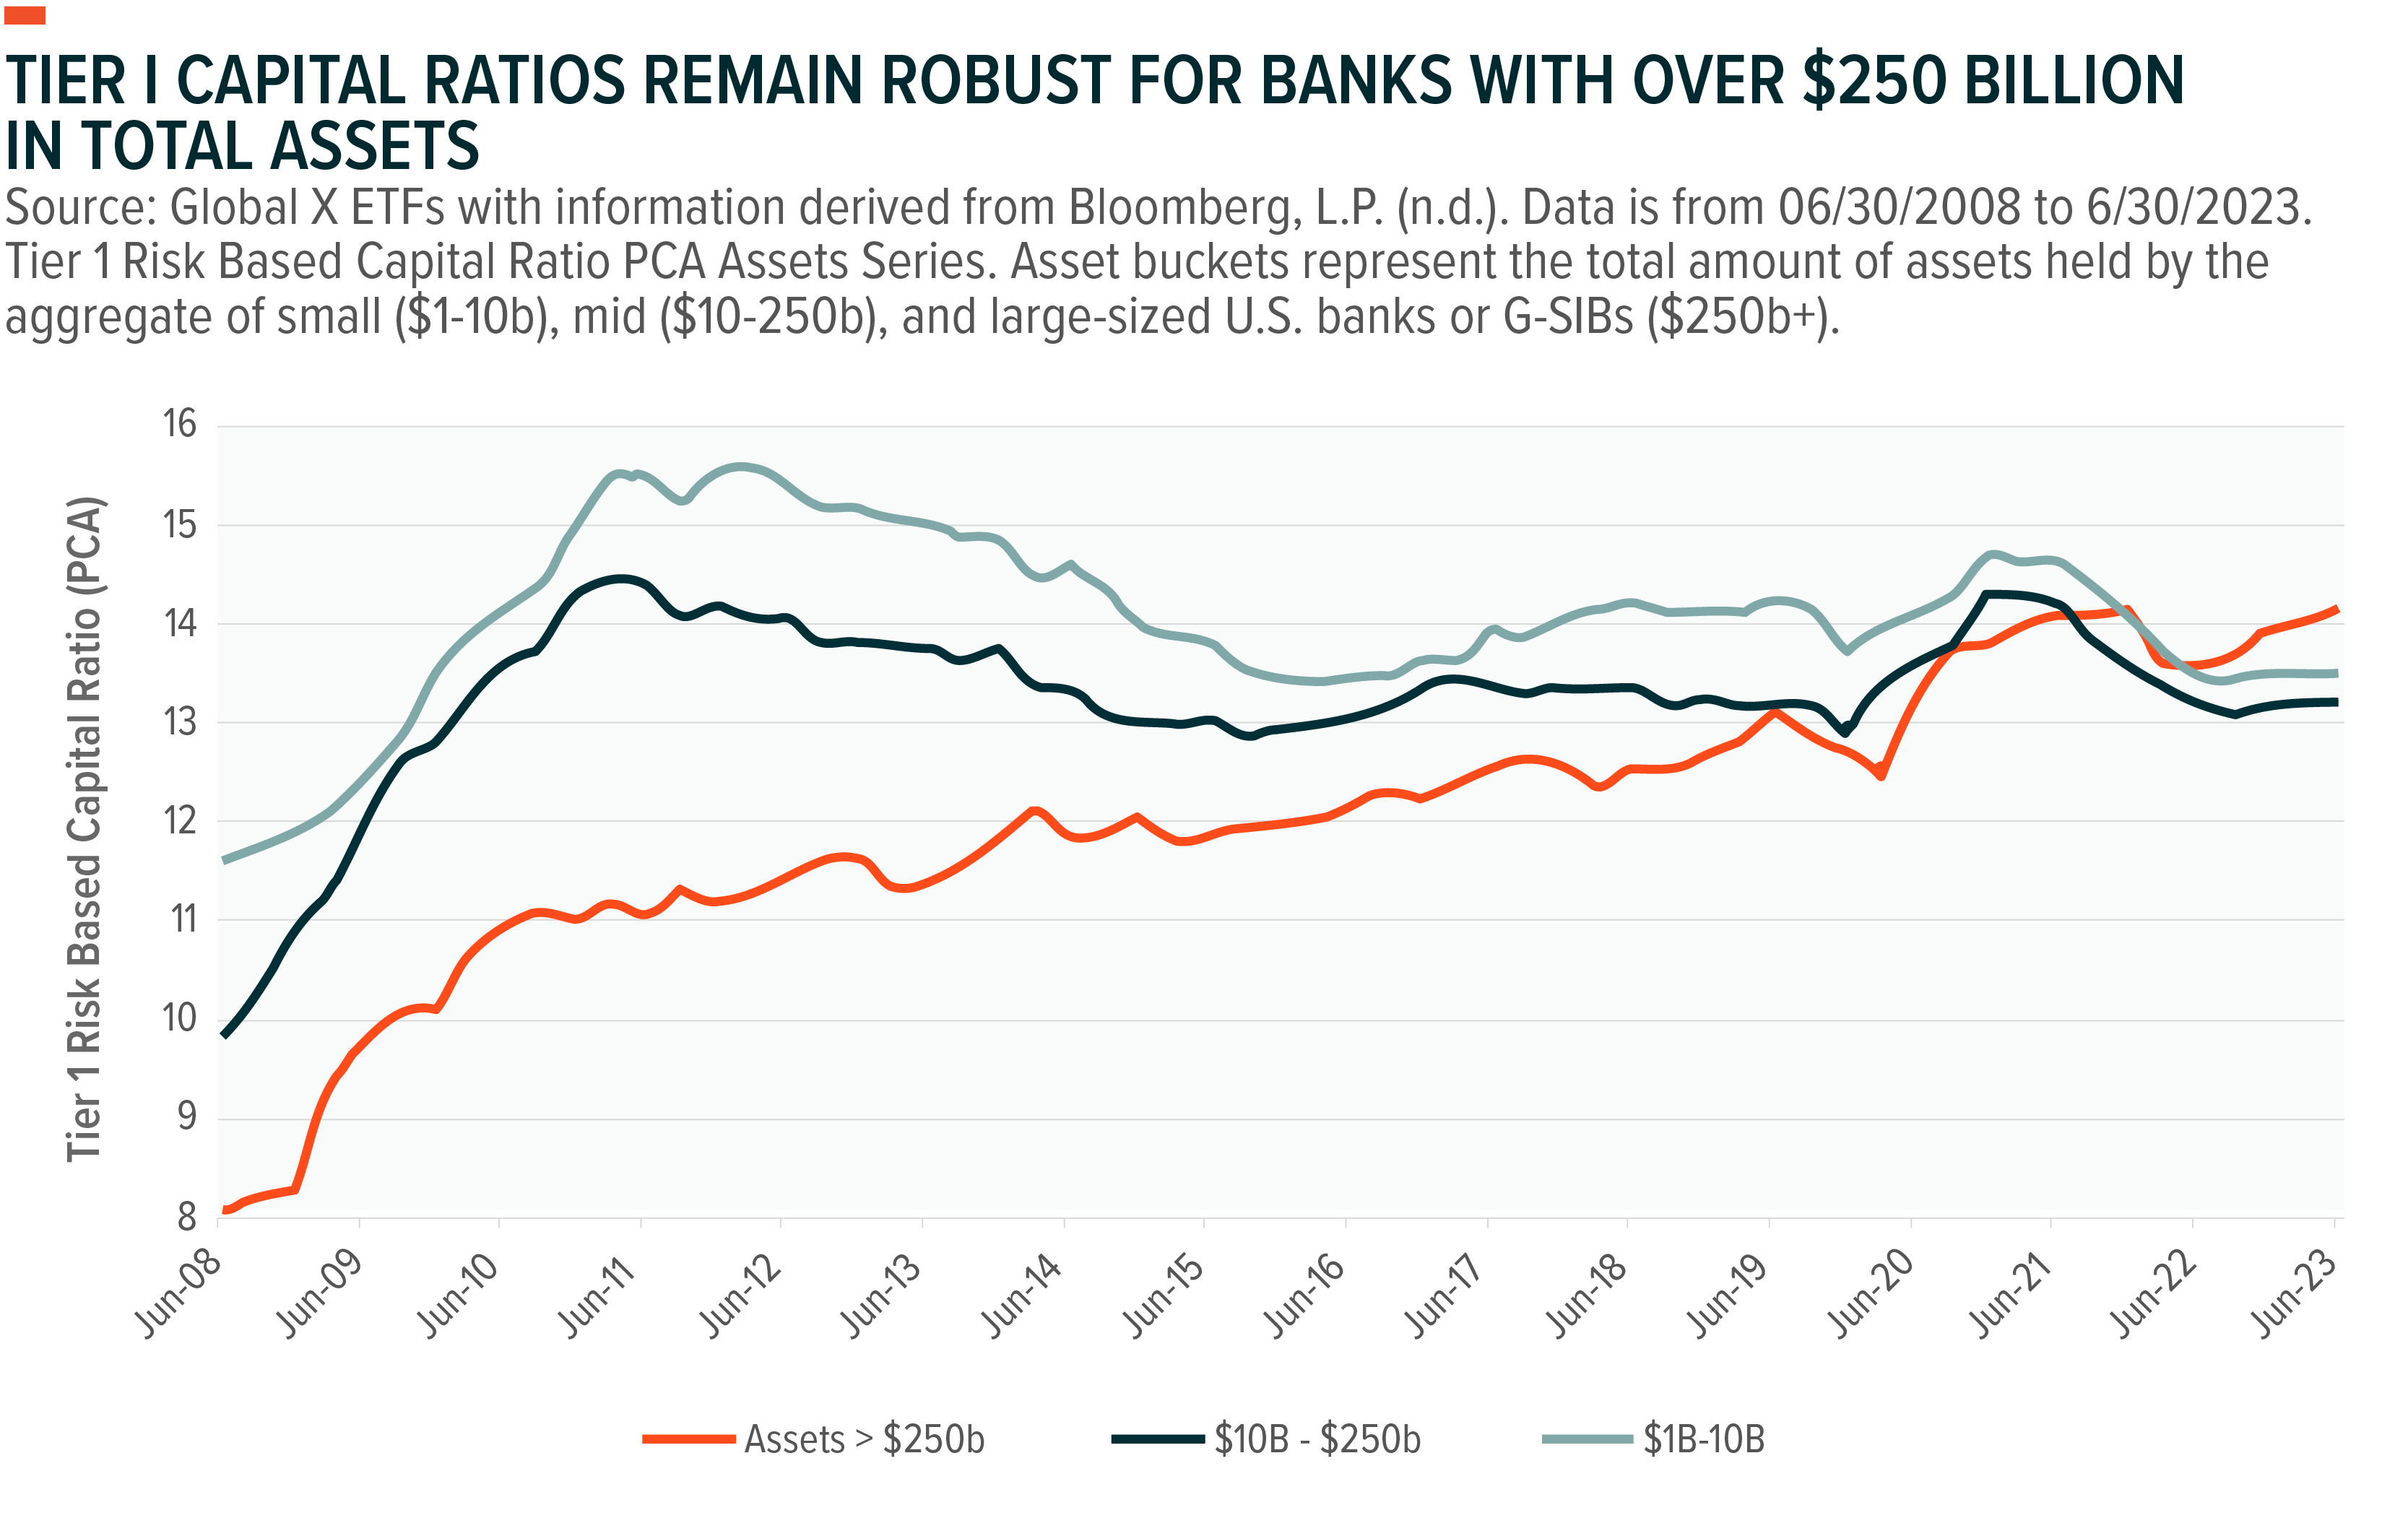
- G-SIBs continue to demonstrate strong capital positions, in excess of thresholds established by regulators over a decade ago. Common equity tier 1 (CET1) capital ratios have remained consistent over the past few recent years, signaling strength amongst the largest, most diversified banks.
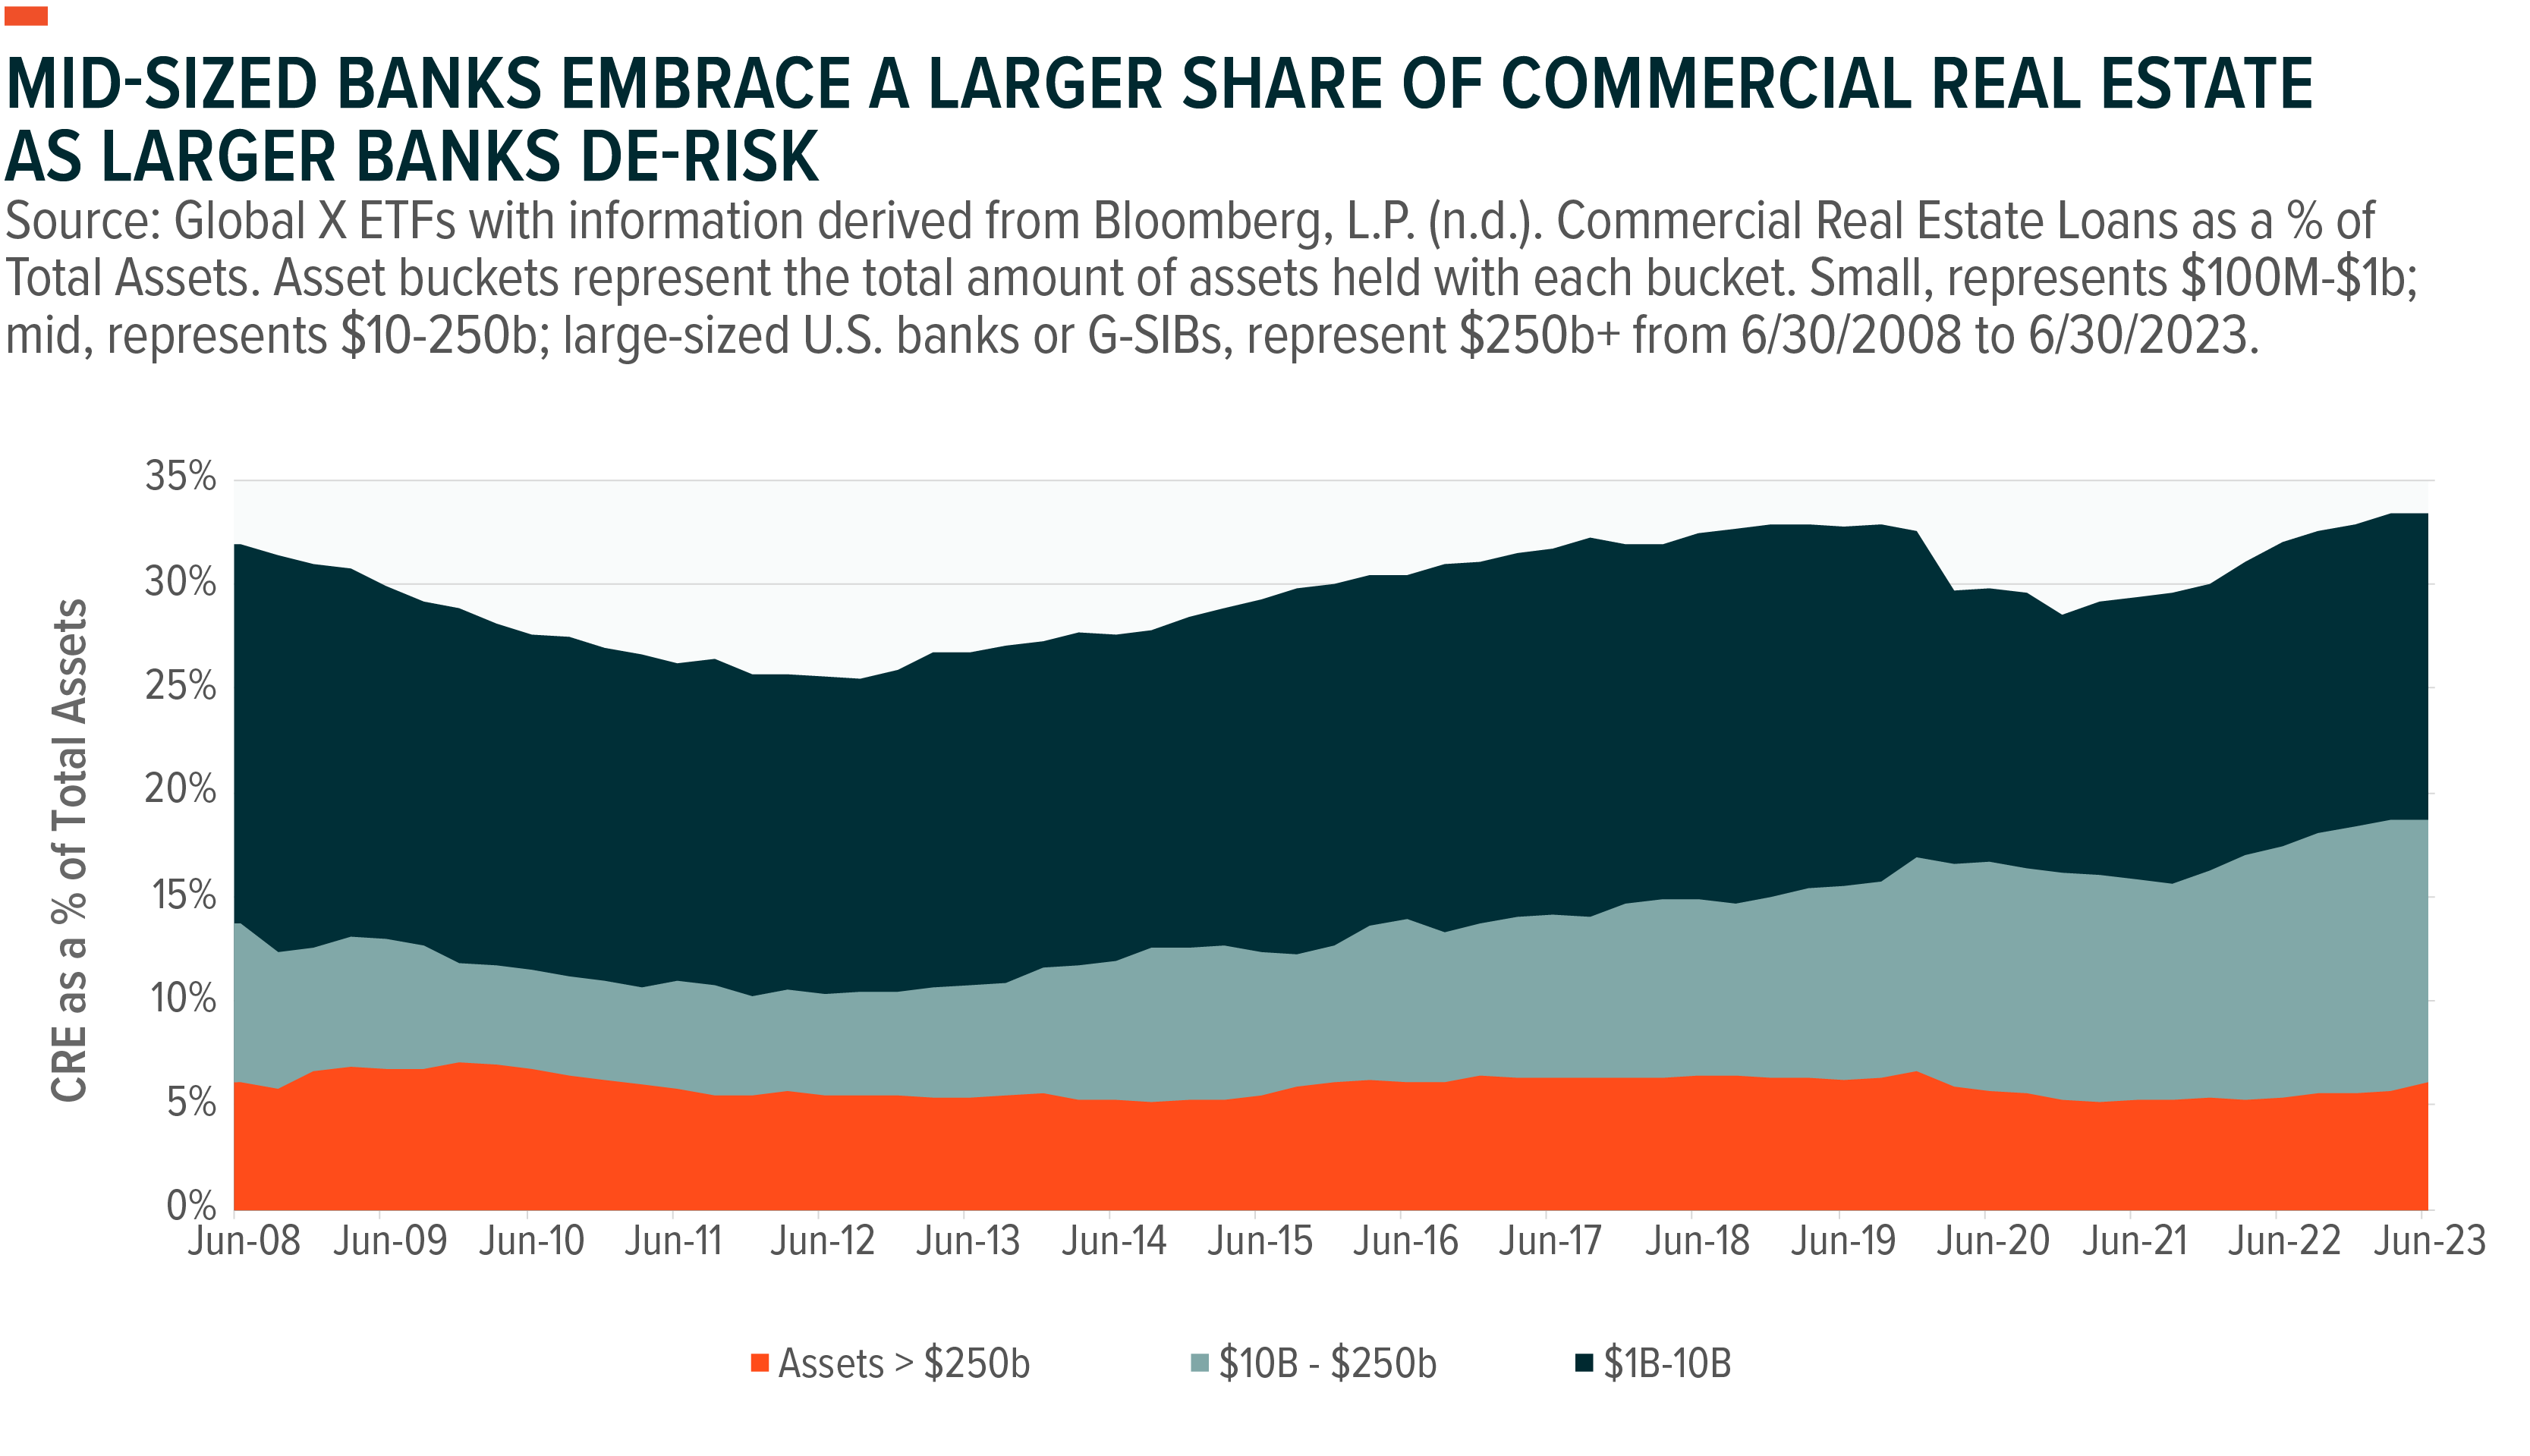
- As rating agencies have begun to scrutinize commercial real estate (CRE) exposure, G-SIBs have actively reduced their CRE exposure. Meanwhile, other smaller segments of the banking ecosystem have been increasing their share of the CRE market over the same period, potentially an attempt to mitigate credit risk by the larger banks.
Effects of Elevated Interest Rates on Bank Profitability
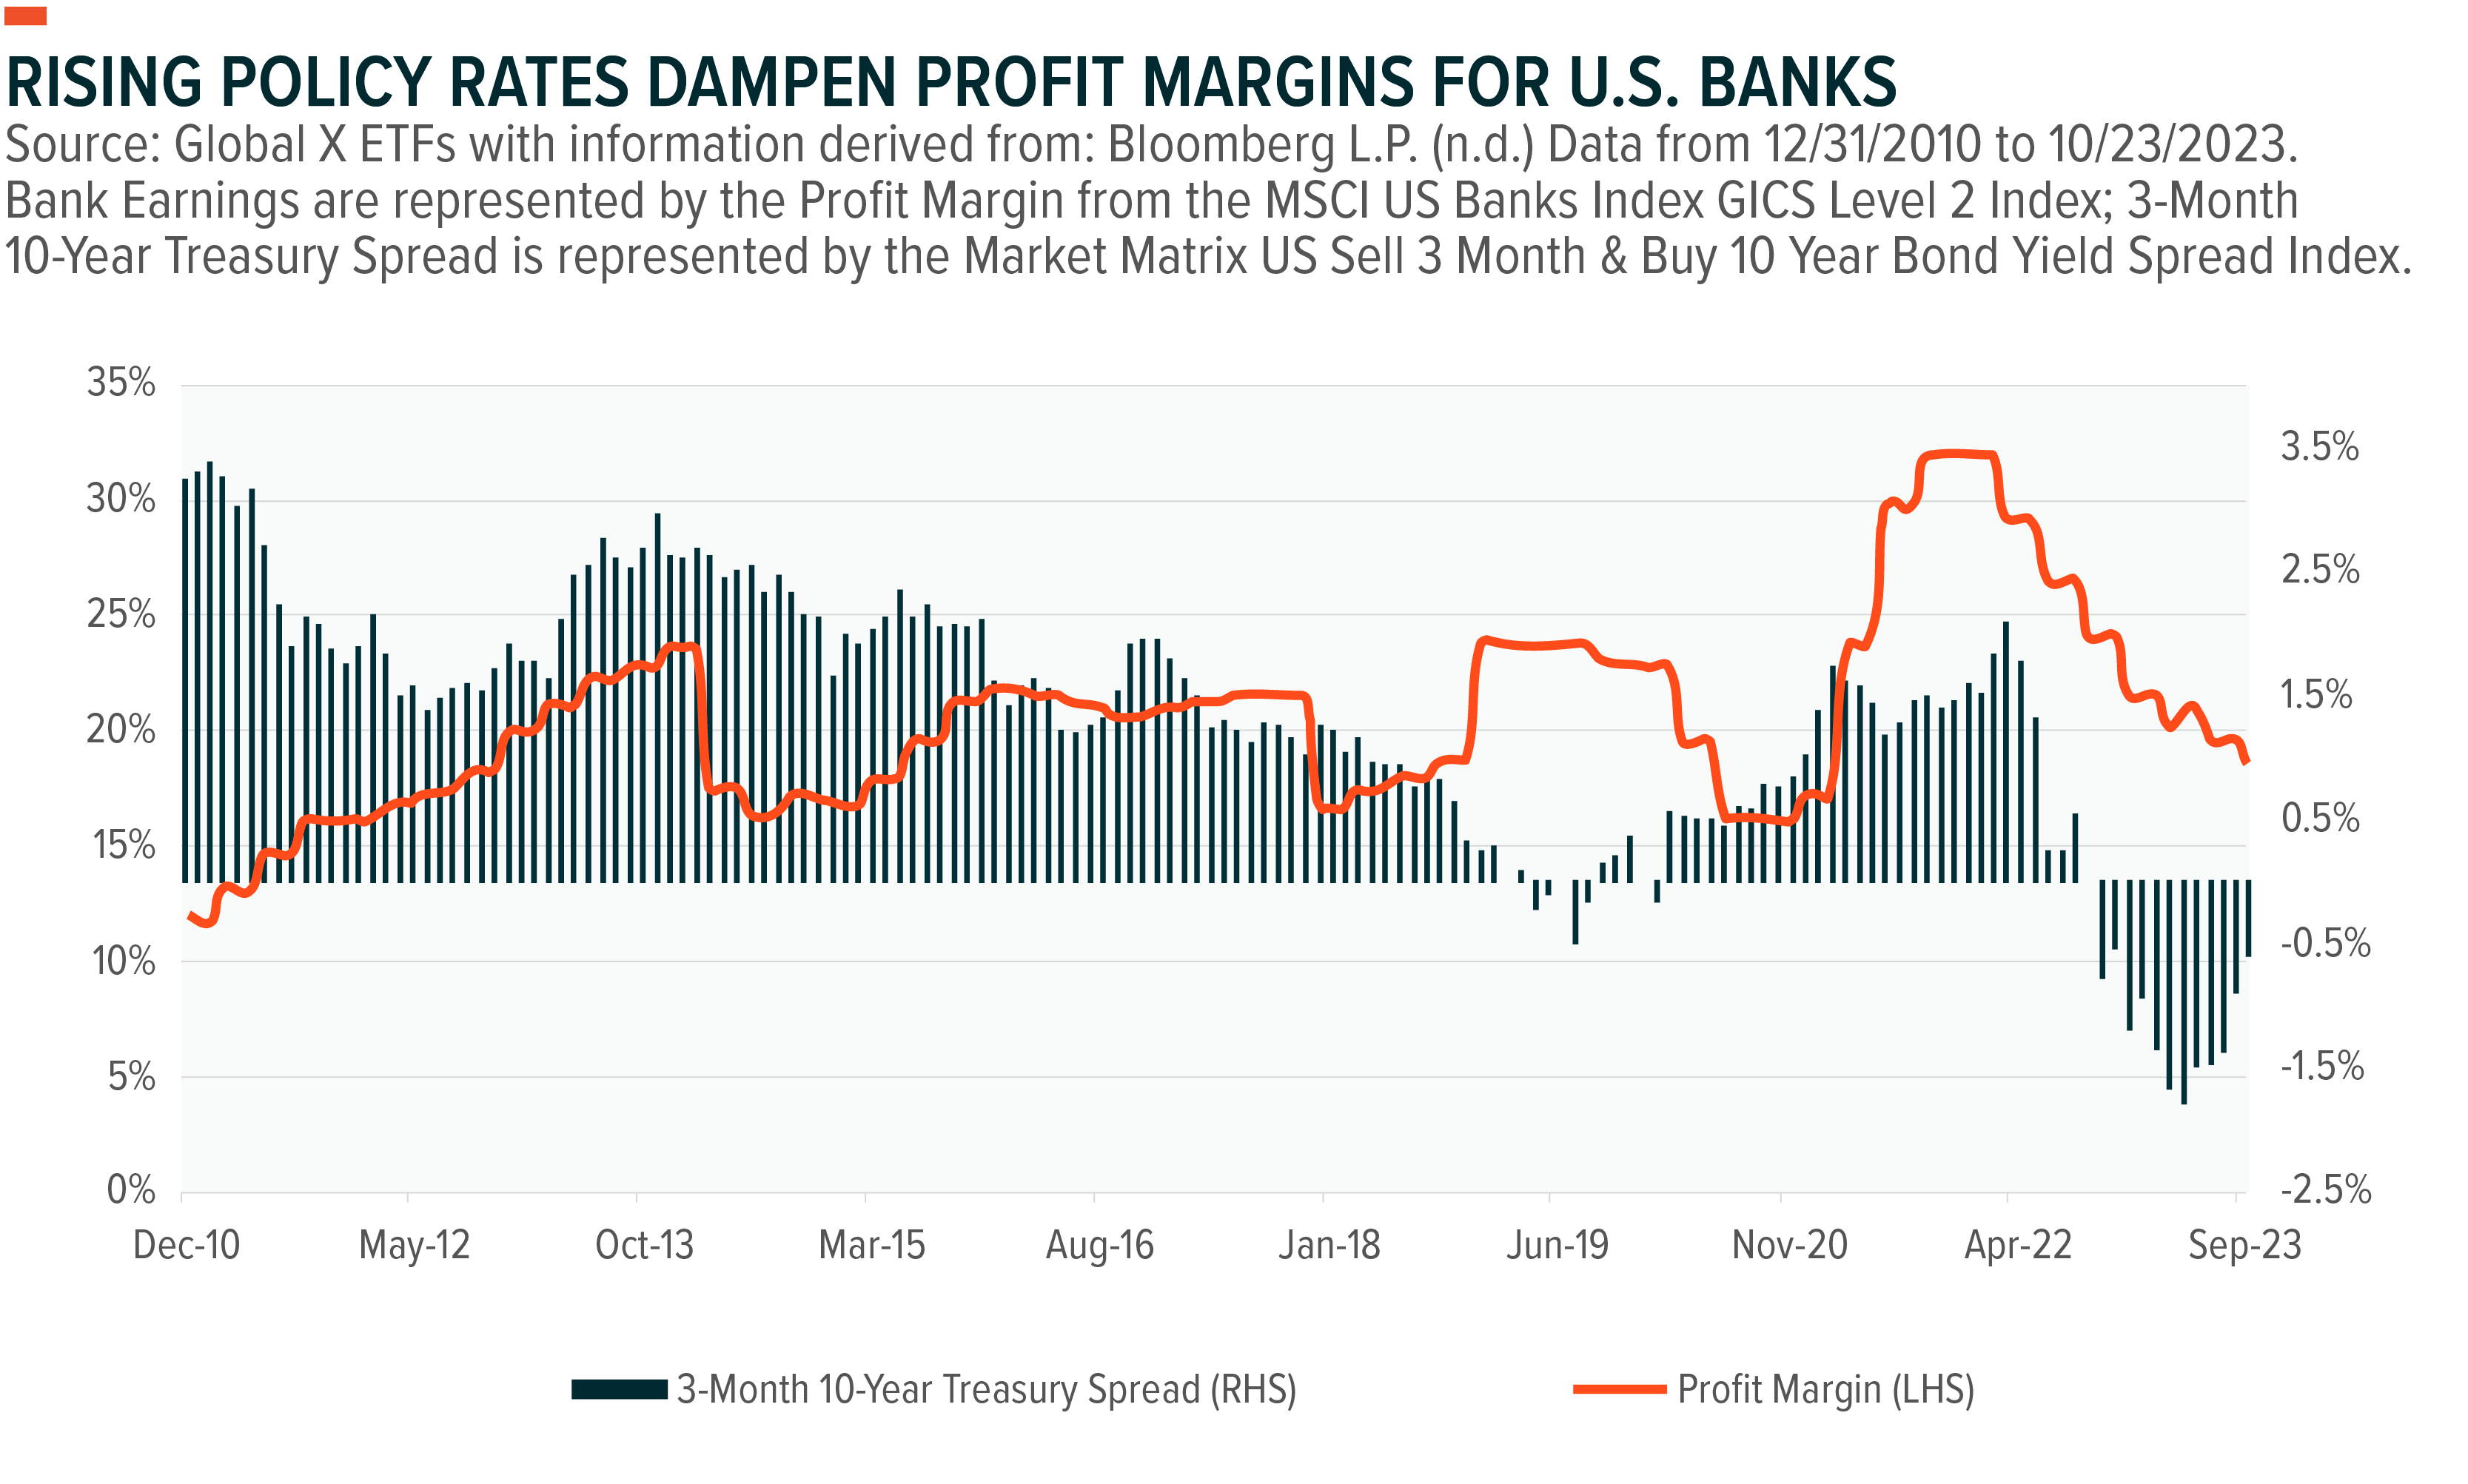
The market and rating agencies have been grappling with the increased likelihood of higher, sustained policy rates for months. As the chart depicts below, higher front-end rates have caused the treasury curve to invert, as represented by the 3-month 10-year spread. This inversion is having an impact on banks’ profit margins for two main reasons. The first reason is that banks tend to borrow at short-term rates and lend at long-term rates. The tighter the spread, the more compressed the net interest margin (NIM) becomes, leading to lower profit potential. This can also slow lending activity and have a negative impact on the outlook of economic growth, creating a feedback loop that pushes long-term rates lower. The second reason is that, as alternative savings instruments like money market funds gain appeal when front-end rates rise, net deposit costs tend to rise in parallel. Banks tend to raise deposit rates to retain deposits, which affects their net interest margins as funding costs rise. Additionally, loans held by banks tend to have a negative correlation with interest rates, potentially causing the asset side of the equation to decline.
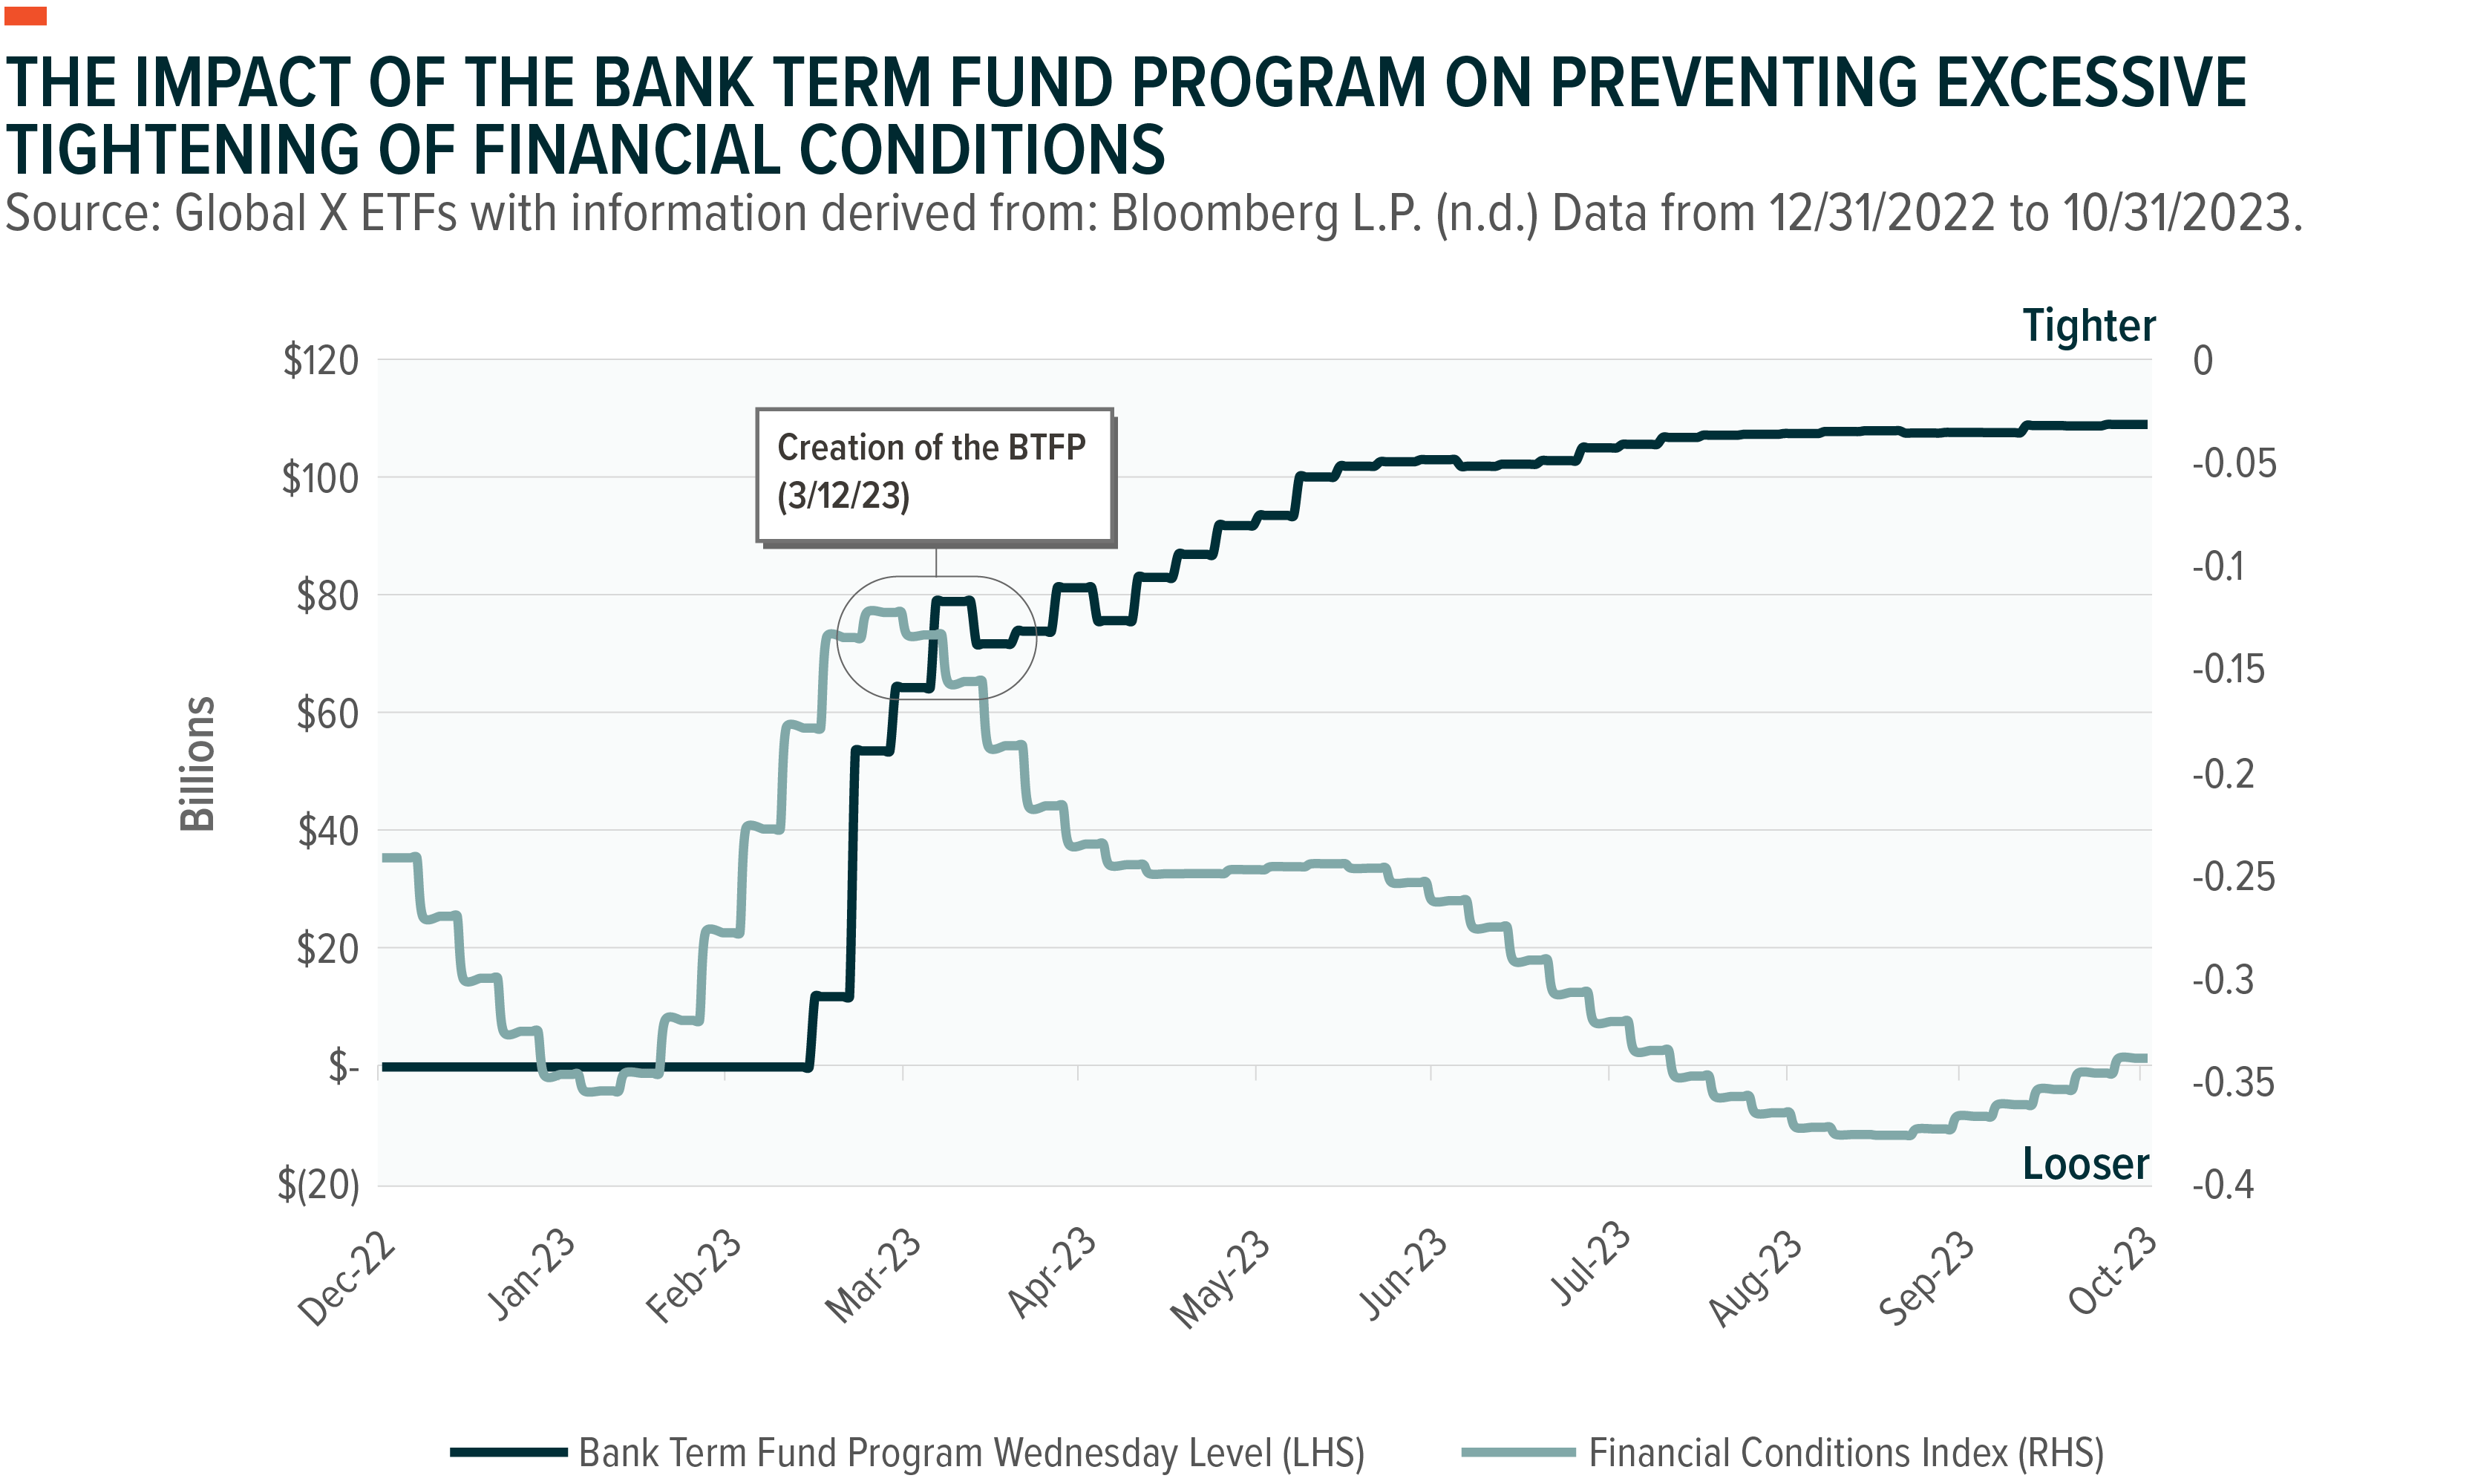
Introduced in March 2023 in the aftermath of the Silicon Valley Bank and Signature Bank failures, the Fed’s Bank Term Funding Program (BTFP) helped mitigate some of these profit concerns.1 Unlike the more traditional discount window, which values posted collateral on a market-to-market basis, meaning that the collateral is priced at the current trading or market price, the BTFP holds eligible securities at their par value, or the original value amount. This approach effectively mitigates the impact on the asset side when banks need to sell eligible securities to match deposit outflows. Such a measure can play a crucial role in preventing a significant hit to their balance sheets, especially when the assets are designated as “held-to-maturity” and valued at par. In the event that a bank needs to sell a security due to a high level of deposit outflows, this sale can trigger a revaluation of the security to its lower, market-depressed price resulting from higher interest rates, leading to a decline in earnings and potentially further deposit outflows. The BTFP has contributed to reducing contagion and the likelihood of a “bank run” scenario.2
The Fed’s new monetary tools helped alleviate tighter financial conditions, as shown below. At the Federal Open Market Committee (FOMC) meeting in September, Chair Jerome Powell reinforced the “higher for longer” narrative, vocalizing that while the end of this hiking cycle is near, borrowing costs must remain at the current elevated level for an extended period due to renewed economic strength.3,4
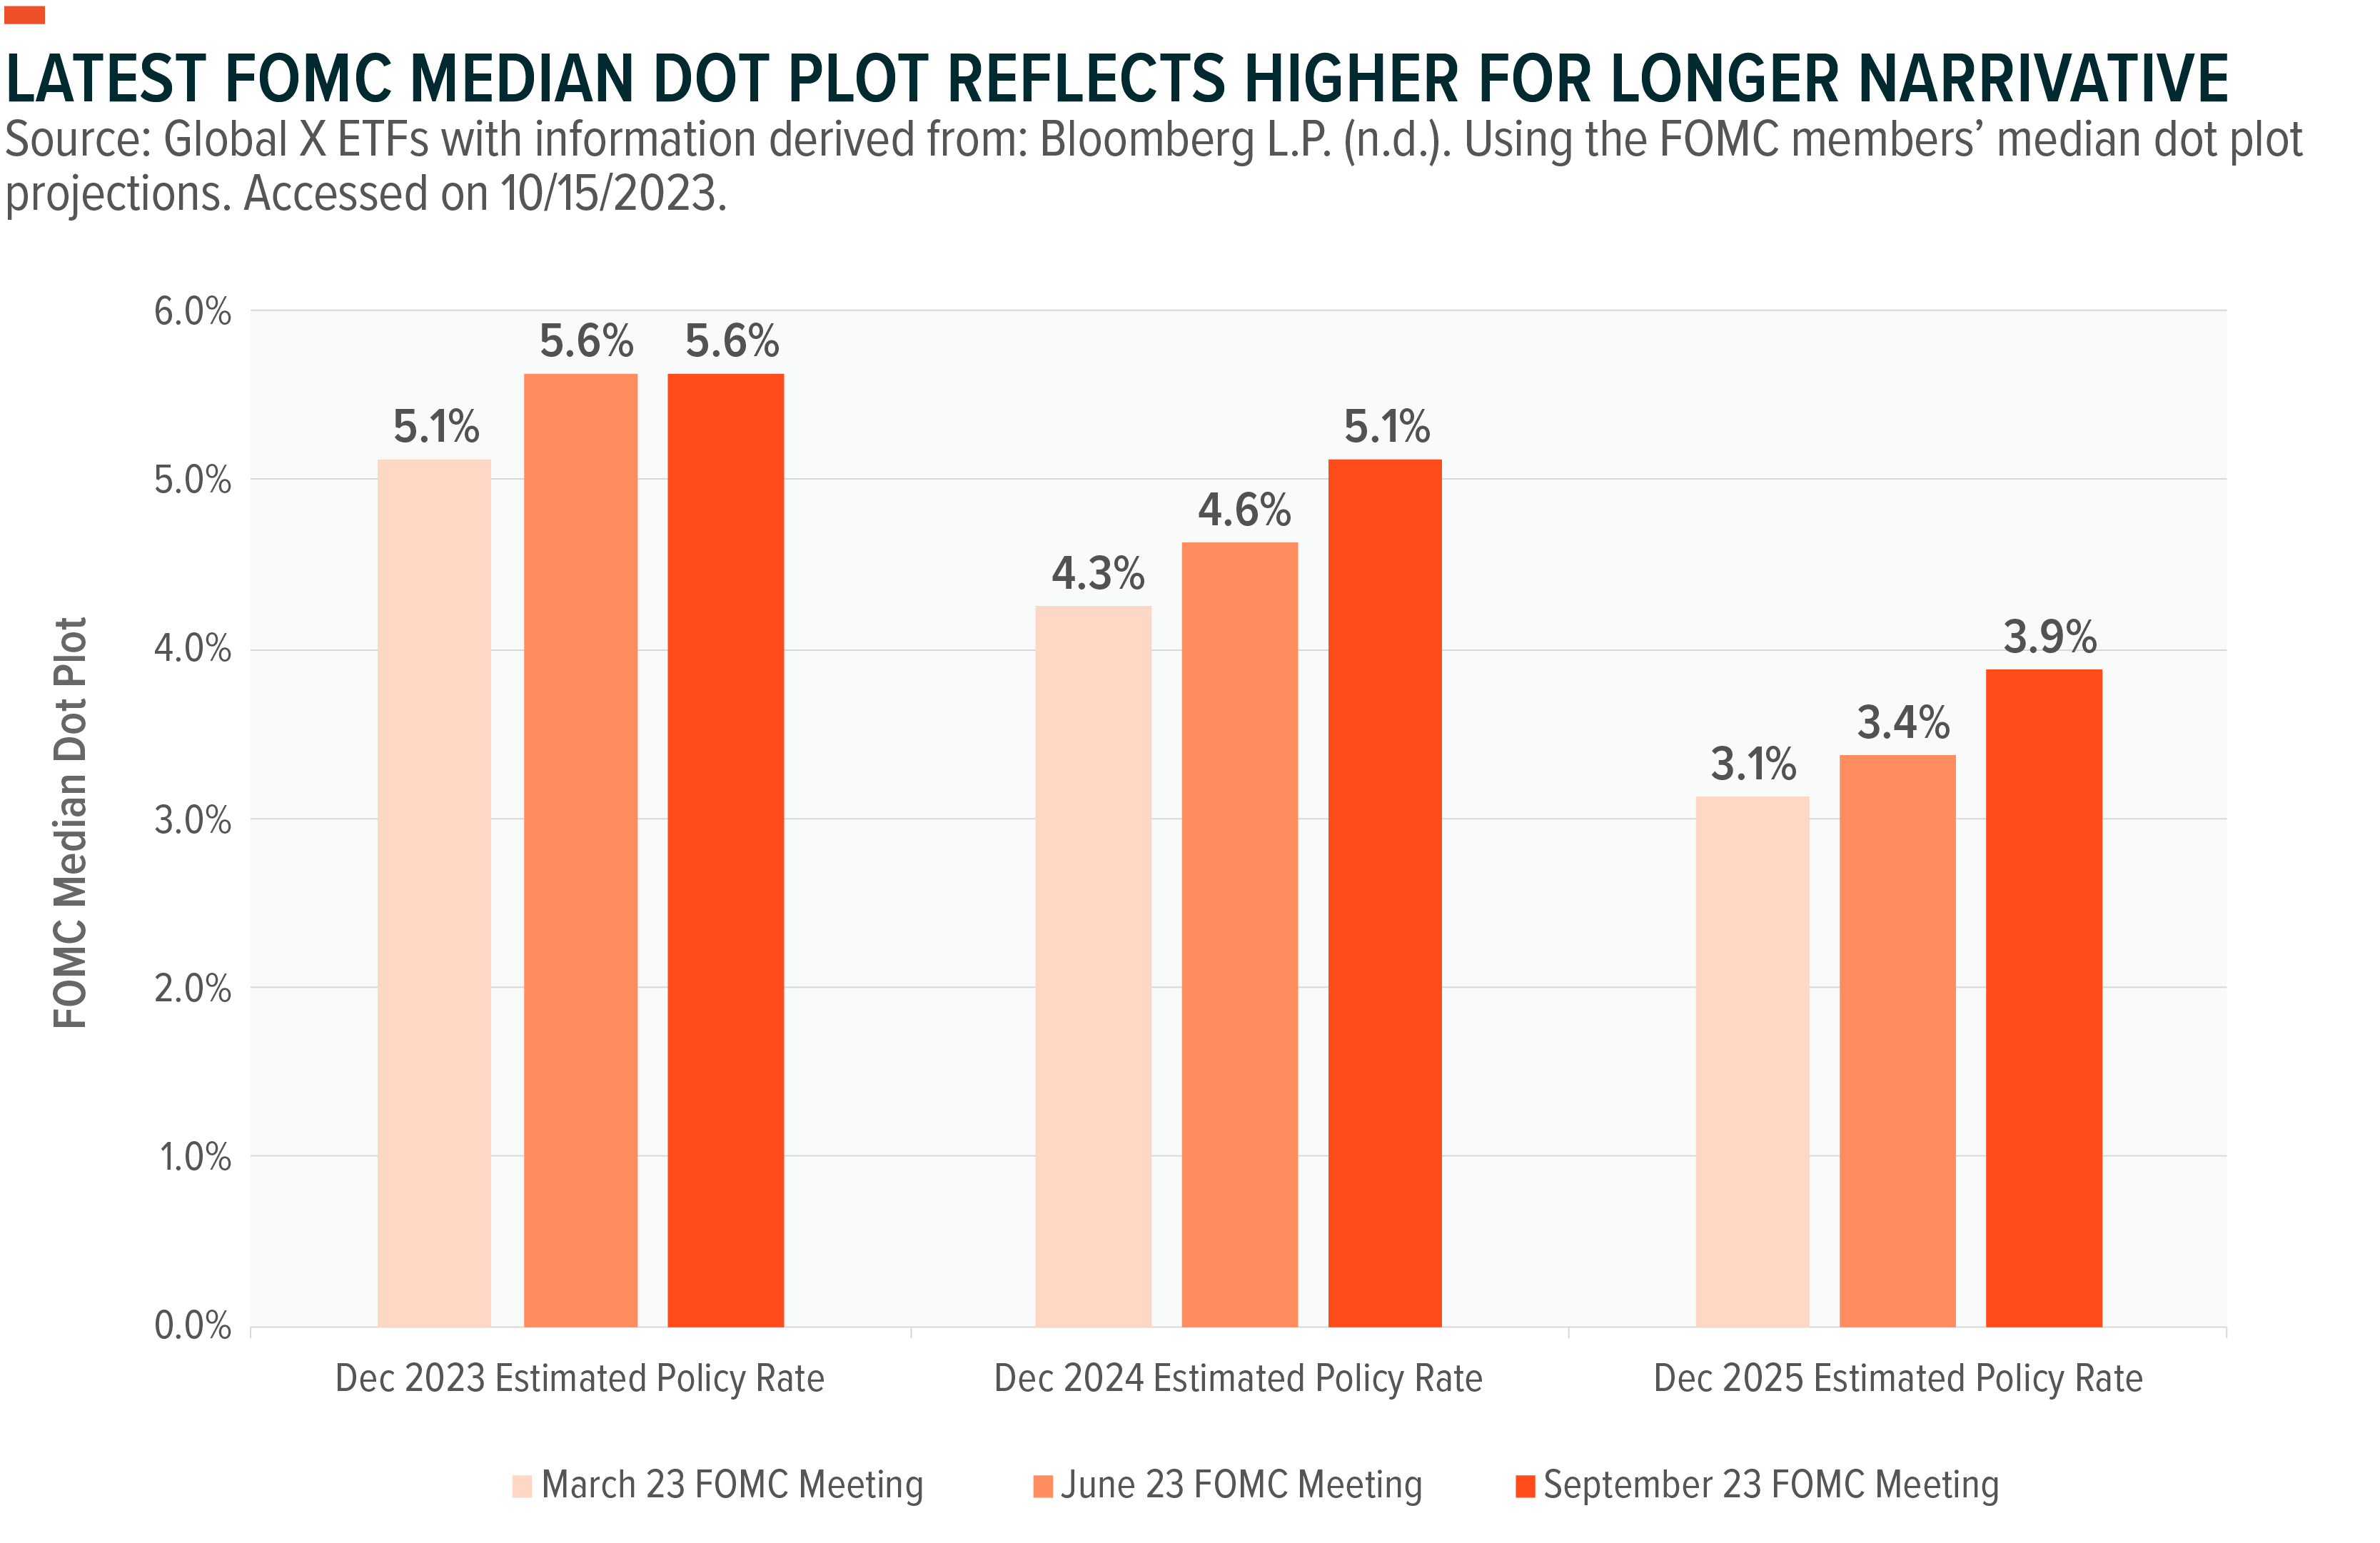
The FOMC’s median dot plot over the last three projections reinforces this view. Front-end rates remaining elevated may make money market funds and other instruments more attractive for longer periods. The potential for increased deposit outflows from banks most susceptible to a ‘bank walk’—a gradual outflow of deposits—is not as concerning to larger depository institutions due to their diversified revenue channels and their ability to maintain tighter deposit rates compared to smaller institutions.
Rating Agencies Concerns Highlight G-SIBs’ Financial Strength
Following the regional banking debacle, Fitch’s decision to downgrade the operating environment for U.S. banks from AA to AA- in June did not immediately lead to downgrades of individual banks.5 However, this sparked concerns among investors, as rumors circulated of potential further downgrades. It’s important to note that individual banks cannot be rated higher than their operating environment. Thus, another downgrade would necessitate Fitch to reevaluate ratings for over 70 banks, irrespective of their balance sheet health.
Fitch remains neutral on the operating environment, and on August 17th stated that several scenarios would need to play out for it to consider a change in stance:6
- Deep impact from regulatory responses on bank profitability;
- Credit losses on longer-duration holdings like CRE loans exceed normalized losses;
- Tighter credit conditions persist for an extended period; and
- Non-normal net deposit outflows from bank deposits.
In August, Moody’s joined the chorus of concerns about rising rates, downgrading 10 banks and placing six others on negative watch. Two weeks later, S&P downgraded five regional U.S. banks by one notch and signaled negative outlooks for several others. All the banks downgraded by Moody’s are classified as regional banks.7
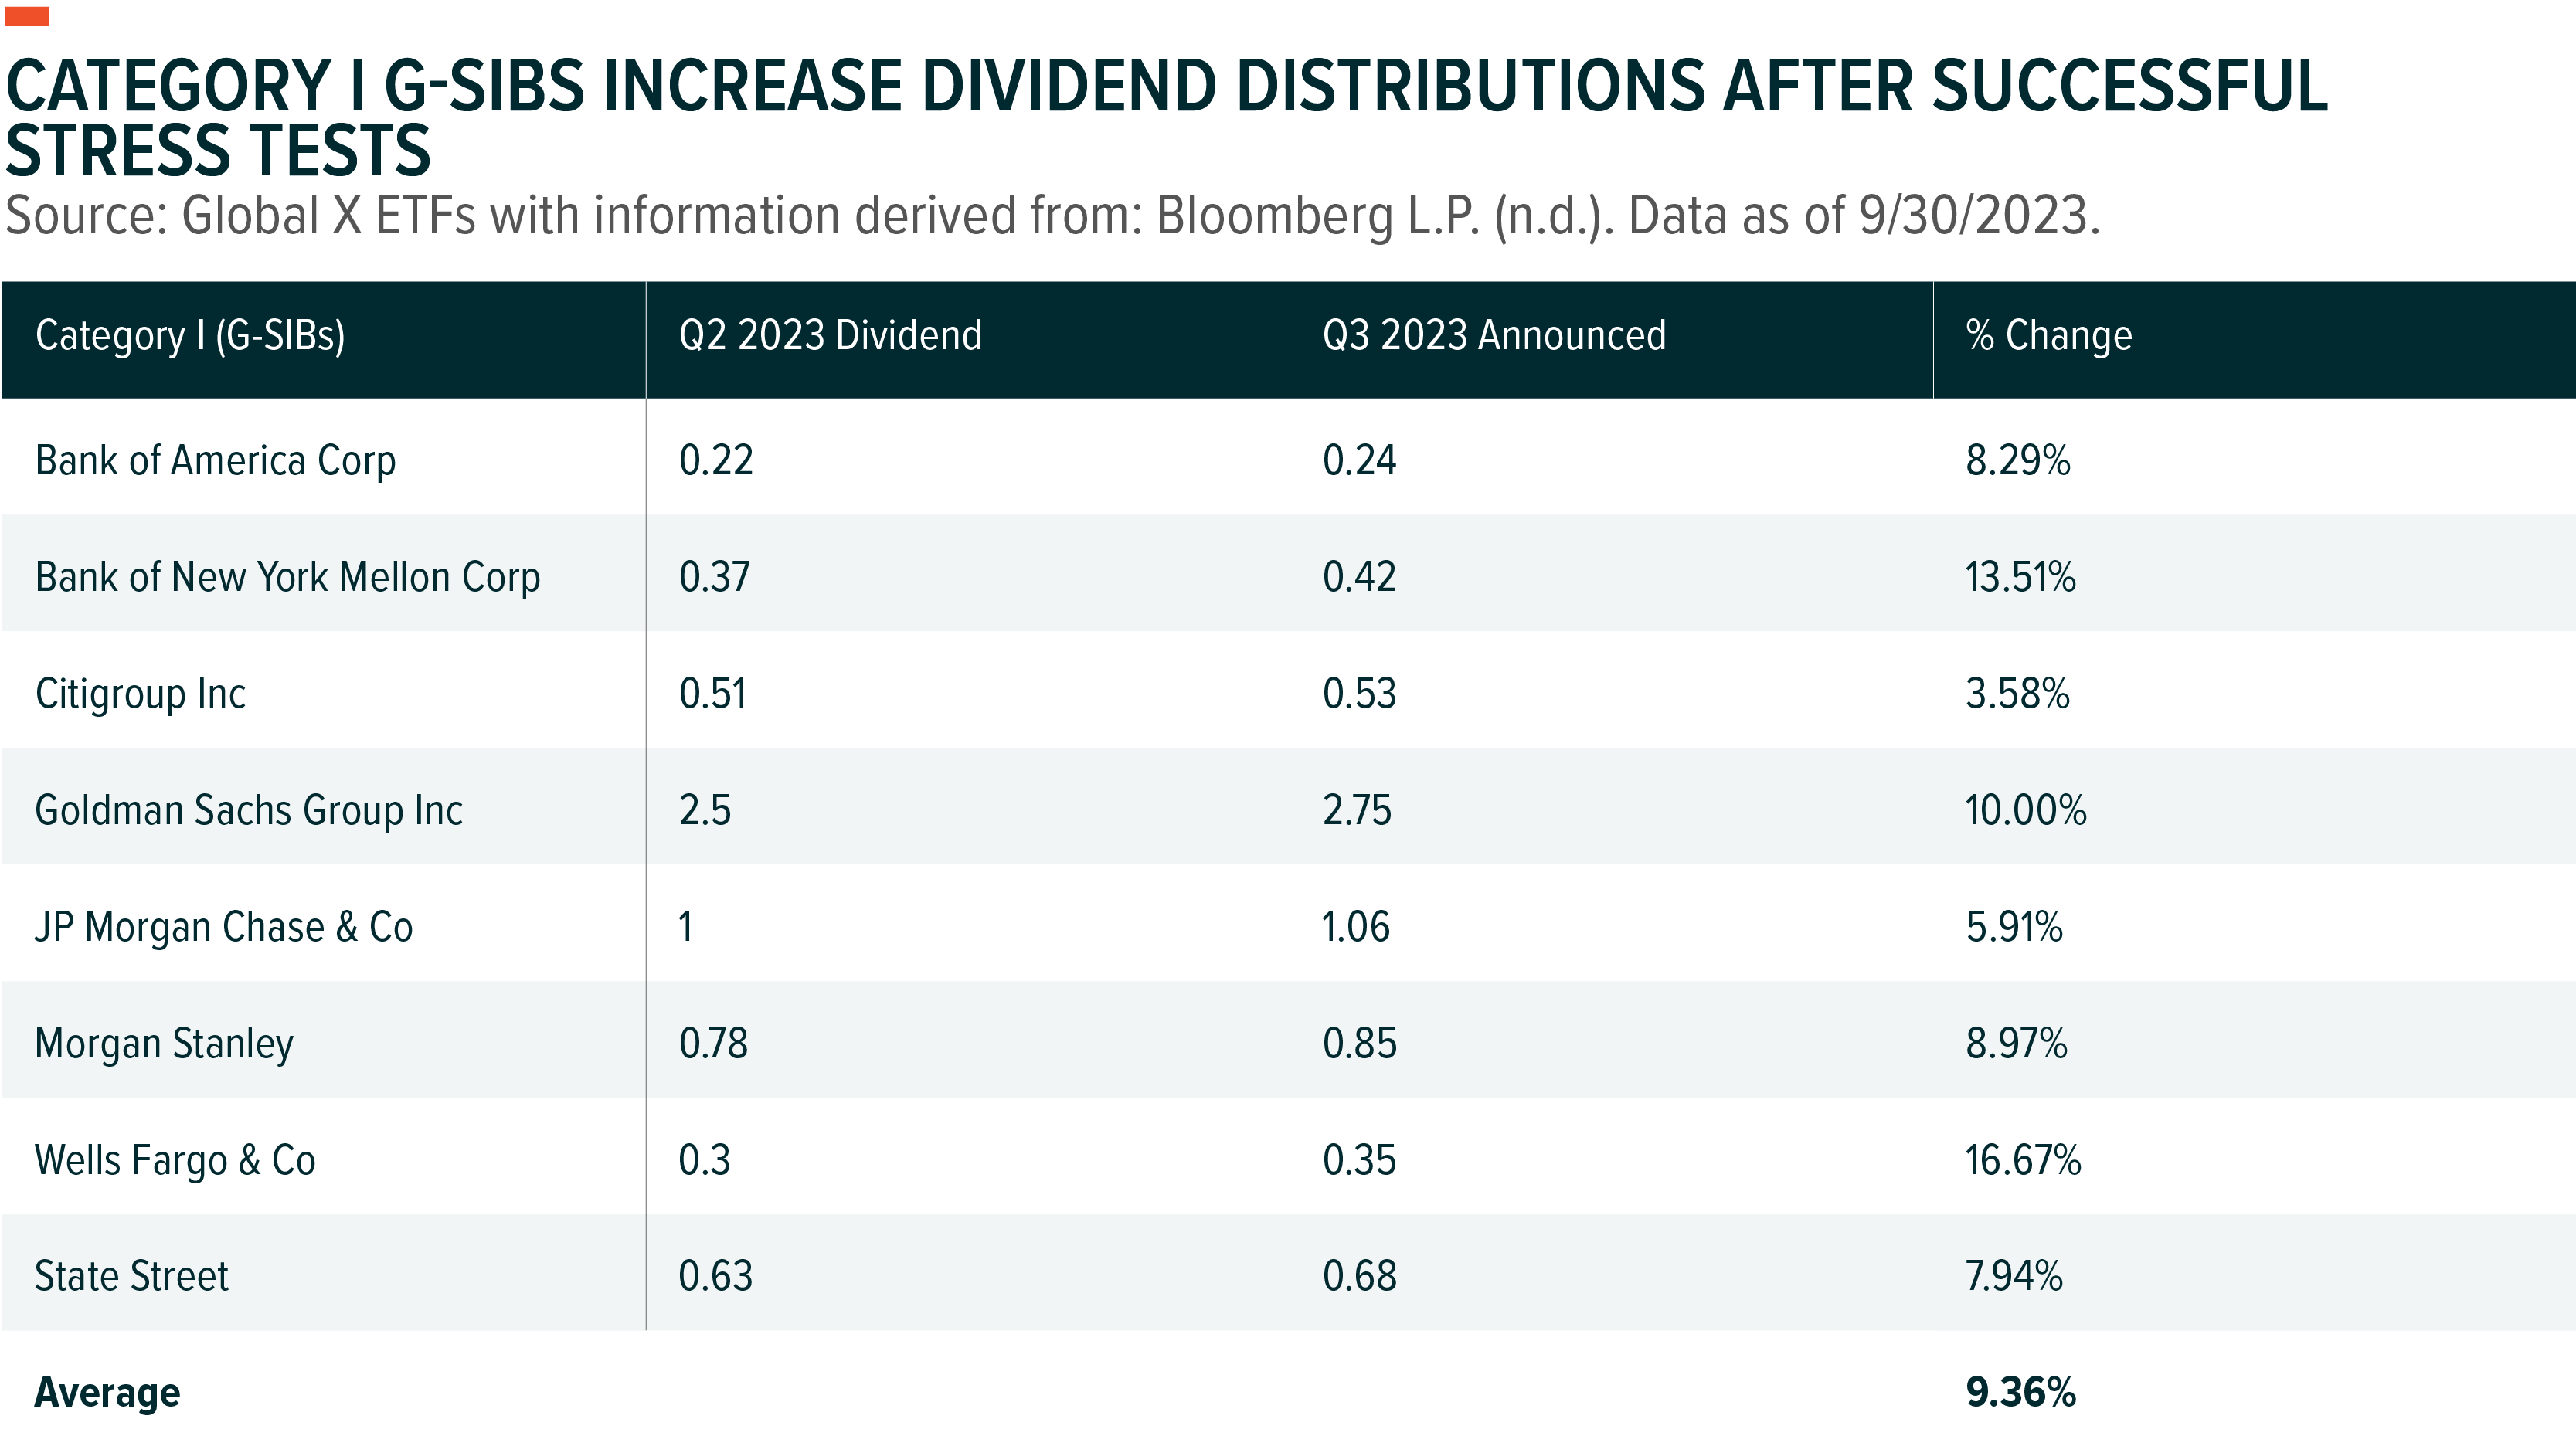
Regional banks being the focus of downgrades underscore the resilience of globally systematically important banks. On June 30th, the 23 largest U.S. banks cleared the Fed’s annual stress test, demonstrating their capacity to meet capital requirements even in a hypothetical recession. The stress test exclusively covers banks categorized as G-SIBs, which adhere to more stringent regulations compared to their counterparts.8 Notably, the eight largest banks, known as Category I G-SIBs, promptly raised their Q3 dividends once the mandatory waiting period following the stress test results had concluded.
Beyond the rise in common equity dividends, these banks continued to grow earnings. Highlighted in Q2, JPMorgan reported a 67% year-over-year (YoY) increase in earnings, and Wells Fargo reported a 57% YoY increase. Among the broad basket of diversified banks, there were upside surprises in Q2 earnings of 8.14%, compared to 2.3% for the regional bank index counterpart.9 This trend has continued into Q3, with nine out of ten banks reporting as of October 24th. Over 50% of US diversified banks have beaten earnings by at least 10%, and all the banks have beaten revenue, except for PNC Financial Services. In comparison, regionals have, on average, missed revenue by -0.04% so far.10
Large Diversified Banks Caught in a Regional Bank Regulatory Storm
Parallel to the rating agencies, regulatory authorities embarked on a course to mitigate the risk of contagion if regional banking woes see a spark from higher rates. In late August, regulators unveiled a proposal to extend the long-term debt requirements which were initially established under the Total Loss-Absorbing Capacity (TLAC) rule for banking institutions holding assets above $250 billion following the Global Financial Crisis (GFC). On August 29, 2023, U.S. federal banking regulators issued a joint notice of proposed rulemaking that would require certain mid and large banking organizations to issue and maintain minimum amounts of long-term debt (“LTD”) for banks with assets between $100 billion to $250 billion, a segment that was previously not part of the TLAC requirements.11
These proposed standards would have applied to institutions at the center of the regional banking crisis, including Silicon Valley Bank, Signature Bank, and First Republic.12 In the future, such standards could ease the strain on the Federal Deposit Insurance Corporation (FDIC) and unsecured depositors, providing banks in this category a larger buffer to address deposit outflows. Only a handful of institutions currently fall into this asset range, including Regions Bank, M&T Bank, Citizens Financial, Northern Trust, and Fifth Third Corp.13
In contrast, the Category I G-SIBs have operated under the TLAC rule for years. The Federal Reserve Board initially embraced the final TLAC requirements in 2016 after undergoing several revisions following the Global Financial Crisis (GFC). These revisions required G-SIBs to reduce risk and ensure compliance with stringent regulations, enhancing their preparedness for economic uncertainties.
The graph below shows that G-SIBs (Global Systemically Important Banks) with total assets exceeding $250 billion have maintained higher Tier 1 capital to risk-weighted assets ratios. Higher Tier 1 capital signifies greater financial strength compared to their equity capital and total risk-weighted assets. Conversely, these ratios have declined for small and medium-sized banks. This decline underscores why regulators are proposing regulations for banks with over $100 billion in assets. As witnessed during the regional bank debacle, these banks may be more “systemically” important than previously thought, and a new round of failures could potentially spark turmoil in the U.S. economy.
Smaller Depository Institutions Taking a Larger Piece of the Commercial Real Estate (CRE) Pie
Over the past decade, the largest banks have worked to reduce their risk exposure, including in higher profile areas like commercial real estate. While larger banks have been stepping away, regional and smaller banks have filled the void and taken a larger share of the CRE market. According to an early 2023 JPMorgan report, regional banks had 4.4 times more CRE exposure than large banks.14 CRE holdings among the smallest issuers comprised over 200% of common equity tier 1 capital, putting additional pressure on regional bank balance sheets.15 Large banks, those with over $250 billion in assets, now hold CRE assets at just over 6% of their balance sheets on average, in contrast to banks with assets between $10 and $25 billion at 19%, and those with assets between $10 and $1 billion at 33%.16 Both segments exhibit significantly higher exposure levels compared to June 2008, indicating that while the largest depository institutions have been de-risking due to tighter regulations, smaller institutions including regional banks have been stepping in to fill the void.
Part II Overview: The Rise of G-SIBs in the Preferred Space and the Role of the Global X U.S. Preferred ETF
Globally Systemically Important Banks (G-SIBs) have displayed remarkable resilience throughout this unprecedented shift from a zero-interest-rate policy (ZIRP) to the highest federal funds rate since 2001.17 The higher interest rates may indeed impact overall bank earnings, but the solvency risk for these major institutions remains notably low.
We observe certain challenges in the banking sector with common equity and bonds, but an asset type like preferreds occupies a favorable middle ground. Bank common equities may be priced lower due to the de-risking stance adopted by banks, as well as the consideration of a later-stage economic environment. In the fixed-income sector, rising rates and duration present concerns for investors seeking lower volatility, a departure from what these investors have historically been accustomed to
Preferreds issued by the same institutions tend to offer higher yields due to their position lower in the capital stack. The solvency risk associated with the largest banks remains muted, further enhancing the appeal of preferreds, as investors can lock in higher yields for an extended period. In addition, valuations remain attractive in this pocket of the market, potentially creating a nice entry opportunity for value investors looking to invest in the banking sector.
As we delve into Part II of this series, we will explore how Global Systemically Important Banks (G-SIBs) have become significant issuers in the preferred space. We will also examine how the Global X U.S. Preferred ETF (PFFD) can serve as an investment vehicle for those seeking expanded exposure to G-SIBs while delivering an enticing valuation case when looking at metrics like yield-to-worst, compared to other asset classes.
Conclusion: Resiliency in G-SIBs
Considering recent rating agency downgrades and potential regulatory interventions aimed at stabilizing regional banks, sentiments toward the banking sector may have experienced a temporary dampening. However, amidst these challenges, large and diversified G-SIBs have emerged as a beacon of resilience. This is evidenced by their results in the 2023 Fed Stress tests, effectively managing duration-sensitive loan exposure, such as in commercial real estate, and maintaining robust capital ratios. These factors underscore the notable divergence between G-SIBs and their smaller banking counterparts.
Related ETFs
PFFD – Global X U.S. Preferred ETF
Click the fund name above to view current holdings. Holdings are subject to change. Current and future holdings are subject to risk.