Reasons to Consider Adding Preferreds to an Income Portfolio
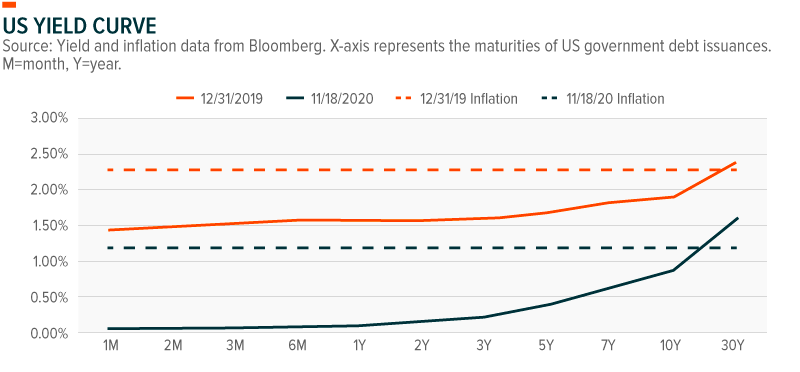
Finding income amid today’s historically low interest rate environment presents a significant challenge for investors. Central banks around the world slashed interest rates to stimulate economic growth during the pandemic. As a consequence of these actions, traditional fixed income sources like government and investment grade bond yields have fallen substantially, often failing to exceed inflation.
Central banks globally are communicating that today’s ultra-low interest rates are likely to continue for several years. The US Federal Reserve, for example, does not believe they will raise interest rates until 2023. Others, like the European Central Bank (ECB) and Bank of England (BOE), appear prepared to increase asset purchases and/or cut interest rates if needed, and are not indicating any rush to raise rates.
In this piece, we explore several reasons why preferred stocks could be a helpful addition to income-oriented portfolios during this prolonged low yield environment.
Preferreds Can Offer Tax-Efficient Yield and Diversification to Portfolios
Preferreds are hybrid securities, exhibiting qualities of both equity and fixed income securities: they trade on exchanges like stocks, but pay regular coupons like bonds. Given their coupon payments, preferreds are duration-sensitive instruments, and therefore can be driven by changes in interest rates much like other debt instruments. Because preferreds are lower on a company’s capital structure than bonds, they tend to carry higher credit risks, but can also exhibit higher yields to compensate for these risks.
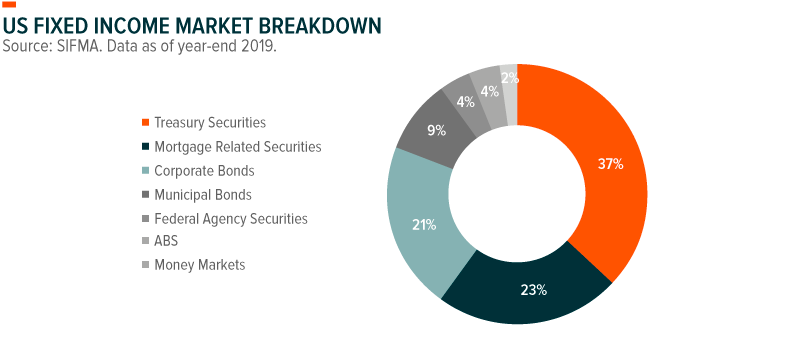
Below is a broad overview of the breakdown of the US fixed income market. While common sources of income like US treasuries, mortgage backed securities, and corporate debt together make up nearly 80% of the fixed income market, preferreds are less than 1% of the overall market.
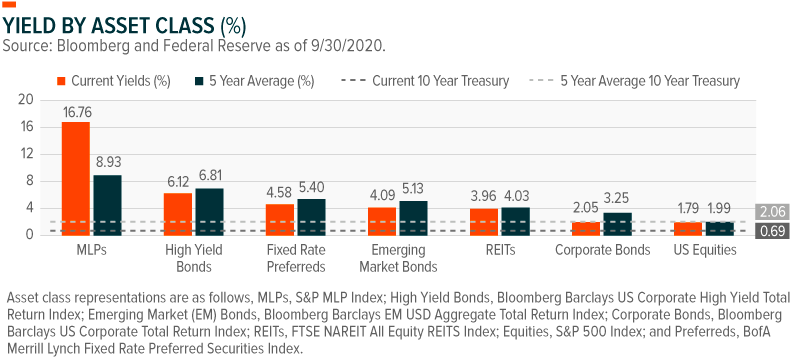
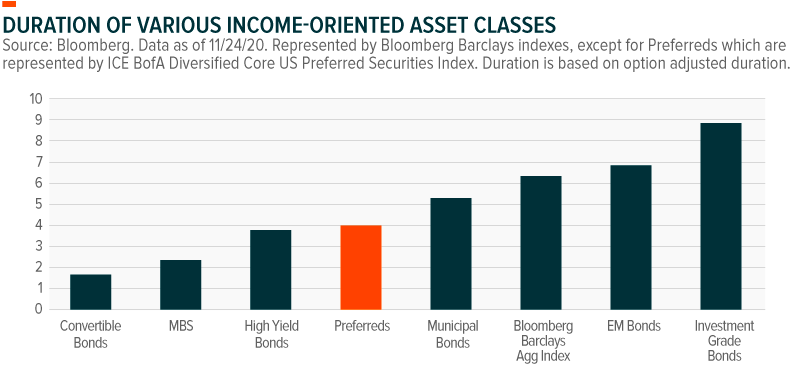
Due to their relatively small size, preferreds can often be overlooked by portfolio managers. But preferreds have unique characteristics, often contributing yield, potential tax benefits, and diversification to investors. For example, fixed rate preferreds currently yield 4.58%, higher than REITs and emerging market (EM) bonds (see chart below). Yet the tax benefits associated with preferreds can often make this yield even more appealing. While bond and REIT income are taxed as ordinary income, preferred yield is often treated as qualified dividend income (QDI). This difference can be material as ordinary income can be taxed at the highest marginal rate of 37%, while qualified dividends are taxed at a maximum of 23.8%.
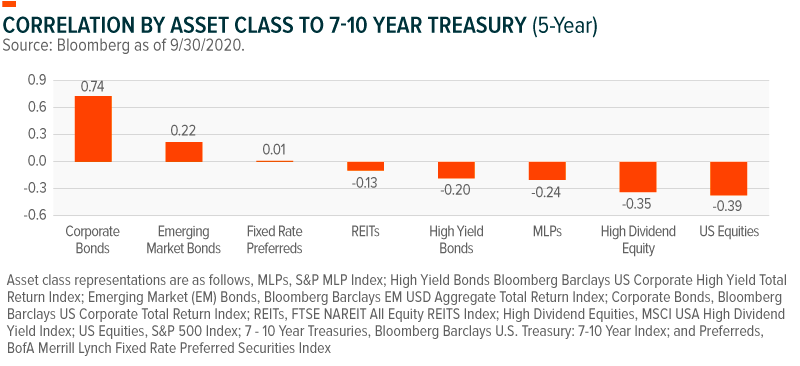
In addition, preferreds have historically exhibited minimal correlation to medium term treasuries, showing that they can be an important diversifier in an income-oriented portfolio.
Credit and Duration Risks Appear Muted in the Current Environment
As discussed previously, preferreds have both duration and credit risk. Therefore, interest rates and credit spreads can drive preferreds’ long term performance. In the short term, technicals can also be a factor.
Duration: The duration of preferred benchmark indexes is around 4, which makes rising interest rates a risk for preferreds going forward. Should rates increase by a quarter point across the yield curve, preferreds are expected to lose 1% of their value. But the lower for longer interest rate environment communicated by the Federal Reserve implies that this risk is unlikely to materialize in the near term. And even if and when interest rates do rise, preferreds are less duration-sensitive than other income asset classes, like investment grade bonds, as shown below. Therefore, while we believe this risk is relatively muted for now, investors can potentially reduce interest rate risk in their portfolios by reducing allocations to higher duration segments and increasing their exposure to preferreds. For investors that are particularly concerned about rising rates, a subsegment of preferreds that have variable coupons (Variable Rate Preferreds) tend to exhibit even lower duration than the broader preferred asset class, with a duration of 2.3.1
Credit: Credit risk is also an important factor because preferreds are junior on a company’s capital structure to traditional debt instruments. This means that – all else equal – if a company were to issue both senior bonds and preferred shares, that the preferred shares would have higher credit risk and higher coupon payments. Credit spreads measure the market’s perception of credit risk, which can be impacted by several factors such as economic strength, sector-specific trends, and company-level performance. Broadly speaking, credit spreads are tight today with the Fed supporting asset prices, which has provided somewhat of a backstop against a weak economy. Should credit spreads widen, preferreds would likely lose value.
Preferred issuers are primarily banks and insurance companies, with financials making up 61% of the preferreds market.2 So the health of the financial sector is a particularly critical consideration when evaluating preferred credit risk. Following the global financial crisis, regulators established new controls to mitigate the risk of major bankruptcies, such as increasing capital requirements. During the COVID-19 pandemic, additional precautions were instituted, with the Fed restricting banks from conducting share buybacks or increasing dividend payments. In Europe, the ECB suggested banks stop paying common dividends altogether. Preferred coupons were exempt from these regulations, and the credit-riskiness of banks appears on solid footing, as capital levels remain high.
Technicals: Technicals, which includes issuances and redemptions of preferred stock and fund flows into and out of the asset class can drive near term performance. When interest rates fall, issuers often refinance callable preferreds at a lower rate, reducing the stock of available preferreds. Market imbalances can also occur when issuances increase, given that preferreds are a more niche asset class. For example, there was $27 billion in issuance in Q3, but net issuance of $18 billion when factoring in the refinancings. But that is coming primarily from $1000 preferreds, up 44% in issuance since the same period last year versus just 9% up on $25 preferreds.3 Fund flows are another factor to monitor as investors often use mutual funds and ETFs gain exposure to the asset class. Assets across preferred stock funds stand at $38 billion for ETFs and $27 billion for mutual funds.4 In October this year, ETFs took in $1 billion, while mutual funds took in $327 million.5 Strong flows to preferreds with limited issuance can drive share prices higher.
Rated Preferreds Can Offer Quality in a Downturn
Like bonds, many preferreds are rated by agencies to provide third party analysis of their credit risk. Targeting preferreds with higher credit ratings is one method that investors can help mitigate downside risks. But many preferreds do not receive credit ratings. This does not mean they are necessarily riskier than those with ratings, but historical analysis shows that non-rated preferreds exhibit steeper drawdowns under periods of duress.
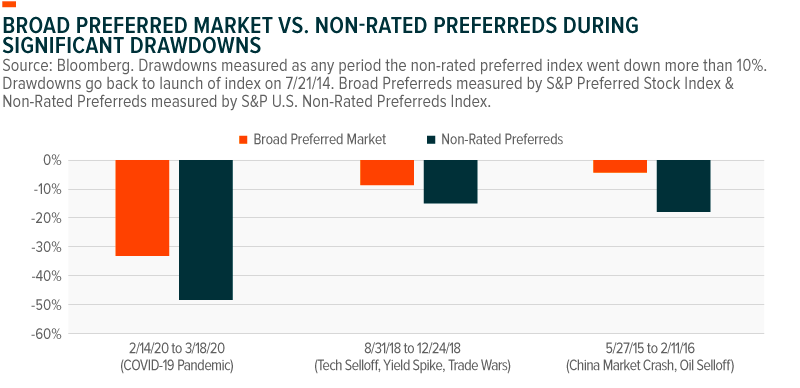
An example of non-rated preferred underperformance is how Mortgage REIT preferreds performed during the COVID-19 pandemic. Many saw their values plummet amid a challenging mortgage market and of the 55 Mortgage REIT preferreds, none had a credit rating from the big 3 rating agencies: S&P, Moodys, Fitch.6 Mortgage REIT preferreds fell on average -61% from the peak to trough in 2020.7
This compares to just a -33% decline for the broader preferreds market.8
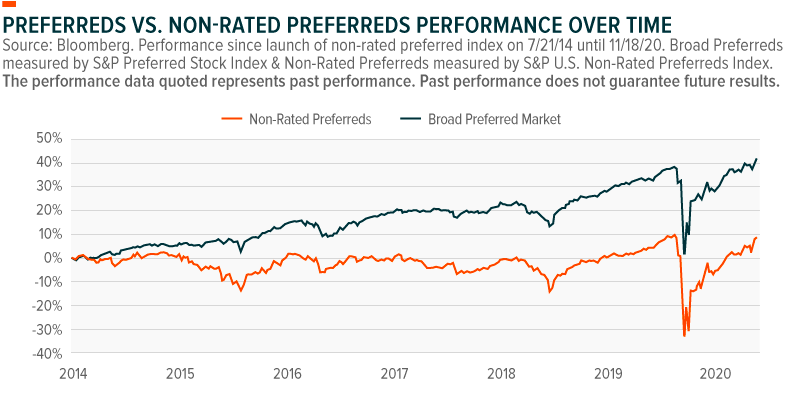
Even outside of major drawdown periods, non-rated preferreds fallen behind over the longer-term. The lack of a credit rating could imply lower quality issuances or business models that are less robust. If investors are concerned about a stalling economic recovery, focusing on rated preferreds or even subset of just higher rated preferreds can help assuage concerns.
Passive Investing in Preferreds Hasn’t Inhibited Long-Term Returns
Investors often turn to professionally managed funds for their preferred exposure. Most preferred stock ETFs are passive in nature, tracking an index of preferred stock, while mutual funds tend to be actively managed. The differences between preferred mutual funds and ETFs can extend beyond management style, including differences in exposures and fees.
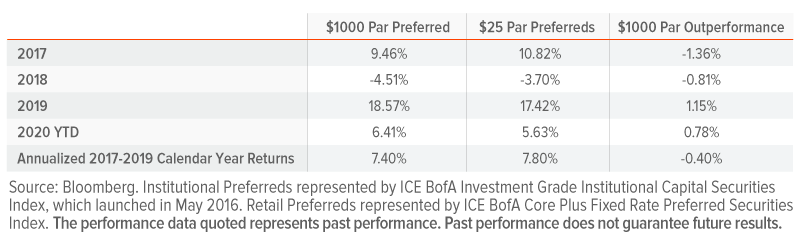
In general, mutual funds are more heavily invested in $1000 par preferreds, a subset of the preferred asset class aimed at institutions. Mutual funds are composed of 60% $1000 par preferreds, on average, compared to just 31% in passive ETFs.9 $1000 par securities are typically traded over-the-counter (OTC) and their coupons are more often variable rather than fixed. Because of these variable coupons, they often exhibit lower duration than $25 par securities, which are far more common, are mainly exchange-traded, and typically pay fixed coupons. ETFs tend to be more heavily weighted in $25 par securities.
$1000 and $25 par preferreds may differ in returns over short time horizons, often due to duration exposures and differences in technicals. But over longer time horizons their performances tend to converge.
Another important difference between active mutual funds and passive ETFs are the fee differences. Active managers charge on average 0.97% on their institutional share classes of preferred funds.10 Non-institutional shares on mutual funds can be even higher and/or charge additional fees. A benchmark-tracking ETF like the Global X U.S. Preferred ETF (PFFD) is priced with a gross fee of 0.24%.11 Preferreds annualized returns are 5.41% over time compared to bonds of 4.56%, and equities of 9.62%.12 Every basis point can make a meaningful difference in preferred fund returns, with average mutual fund fees representing approximately 18% of returns. By looking for funds with lower management fees, investors may be able to enhance their returns from this asset class on a net of fees basis.
Conclusion
The historically low yield environment is putting substantial pressure on income-oriented investors to consider alternative asset classes for potential yield and diversification. Preferreds can be a po tool for achieving greater yield potential due to their junior status on the capital structure. In addition, their relatively small representation in the global bond market and historically low correlation with treasuries allows them to offer diversification to portfolios.
Most often, preferreds are analyzed alongside high yield debt, as they share similar yield properties and credit risks. But even though preferreds are junior on the capital structure to debt, they currently exhibit higher quality characteristics than their high yield debt counterparts. Junk bonds today are most frequently rated between BB- and B+ versus a BBB- rating for preferreds, a full 3 to 4 notches higher.13 This is because preferreds are often issued by investment grade financials firms. Even though there remains substantial economic uncertainty amid a global pandemic, we believe preferreds are well-positioned in this environment as financial firms remain on solid footing, backed by substantial support from the Federal Reserve. In addition, their high yields and below average duration should position them well for the long term.